Download
1 / 27
270 likes | 442 Views
Adaptation indicators at member state level Indicators for the German Adaptation Strategy Kati Mattern Federal Environment Agency Germany. I Roadmap to Indicators for the German Adaptation Strategy. German Adaptation Strategy 12/2008: Mandate for National Adaptation Indicators

E N D
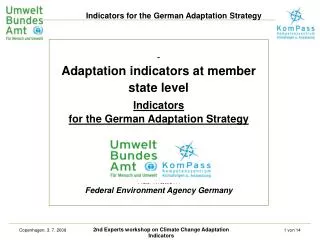
Adaptation indicators at member state levelIndicatorsfor the German Adaptation StrategyKati MatternFederal Environment Agency Germany
I Roadmap to Indicators for the German Adaptation Strategy • German Adaptation Strategy 12/2008: Mandate for National Adaptation Indicators • Draft indicator set, Manual for drawing up an Indicator based report (12/2008-02/2010) • Political accepted Indicator based report and proposal for the implementation (10/2009 bis 2/2011) • Adaptation Action Plan of the Federal Government (03/2011)…. • Establishment of reporting structures • …. • Closing the gaps of indicators and data (2010-2012) • Routine Monitoring und Reporting by Indicators and/or Report of Progress by the Federal Government
II Requirements • Close reference to the objectives and contents of the German Adaptation Strategy • Covering the wide range of issues in the 14 sectors of the German Adapation Strategy • Highlight the cause-effect-relationships of climate impacts • Immediately implementable • Reducing the complexity • Clearly arranged Structuring of „adaptation“ • Reprocucable selection of main focuses
Impacts Sector Key Key Key Core-Indikatoren Federal Proposed, but not calculatable indicators Core-Indikatoren with other data on state level Core-Indikatoren with data only on state level, States Regional indicators The indicator system offers structured links for the Federal States. L Anforderungen Bund und Länder
III Methodology Step 1: Scope „adaptation“ Step 2: Scope of the fields of indication to be reported ------------------------------------------------------------------ Step 3: attribution of possible indicators Step 4: documentation of indicators
Step 1: Scope “adaptation” • DPSIR, but focus on impact and response • Close relationship between impact and response • Give up ambitions for outcome indicators • Clear attribution of indicators to the categories impact, sensitivity
1. Communication of climate impacts 2. Presentation of the effects of implemented adaptation measures Impacts, that will not be influenced byadaptation measures impacts, that will be influenced by adaptation measures Drying-up of wetlands Impact- and the referring response indicators should be presentable in a close relation. Changed behaviour of migrating birds Responses Water retention in Wetlands Step 1: Scoping of adaptation - assumptions Impacts
Sub-aspect Thematic part of an aspect Field of indication Sector of the GAS Impacts on yield agriculture Decreas in yield in several kinds of grain due to shortening of the phase of the corn filling Increase of yield of plants with long periods of ripening (corn, Hirse) Increase of damages in the field due to increased frequency and intensity of storms Change in amount of yield Direct damages to plants Methodik Indikationsfelder Aim of the Structuring: not more than 10 to 12 fields of indication per sector
Methodik Indikationsfelder Sector of the GAS Thematc part of an aspect Sub-aspects Field of indication
210 Methodik Indikationsfelder Fields of indication and attribution of indicators Impacts: 13 x ( 4 to 13) x 1 = 90 Responses: 15 x (6 to 11) x 1 = 120 sectors 1 core indicator Fields of indication • Selection of fields of indication to be reported is necessary! • Selection has to be done reproducable by clearly defined criteria. It should be able to continue the system.
Priorisierung Indikationsfelder Step 2: Scope of the fields of indication to be reported • Development of criteria for the selection of fields of indication • Classification of fields of indication due to criteria, proposal for prioritisation • Discussion of the proposal with experts Criteria - responses: Critera - Impacts: • Thematic relevance • Data availability (first estimation) • cause-effect-relationship to climate • understandability • Public concernment • Dimension of space • Dimension of time • Possibility of action • Political consensus • Reference to impact • Data availability (first estimation) • Measure implemented due to adaptation? • Directness of effect • responsibility
Ranking/Classification of fields of indication by criteria - impacts
Arbeitsstand Priorisierung Indikationsfelder Interim result of Ranking by consultants Mind. 6,5 points
Priorisierung Indikationsfelder Step 2:Scope of the fields of indication to be reported Evaluation of the Ranking by Experts: Workshop in the Federal Environment Agency, Berlin, 22./23. 6. 2009 Experts from Agencies, Science and other organisations aims: • gain acceptance for Methodology • together define main focuses • collect ideas for indicators
Lessons learned from the Expert Workshop • as regards content: • Impacts: • Merging of fields of indication • Neutral formulation of fields of indication (without trends) • Weighing of selection criteria for impacts • Additional criterion: intensity of impact • More transparence in the relationship between impacts and responses • Responses: • Lack of knowledge on implemented adaptation measures results of stakeholder dialogues (e. g. energy, finance, insurances) • Criteria for respnses peferred: political consensus, broad implementation in Germany,not only in case studies, close relation to prioritised fields of indication for impacts, good expactation to available data • Procedural: • Stripping away the predjudices of the experts in the sectors and in science • Stripping away the fears of „cuckoo´s eggs“ • Continuing and Improvement of participation process communication • Expected results: • Different stages of adaptation in the sectors will lead to differentiated set of indicators in 2011
Outlook: Step 3: attribution of possible indicators Conduction of ideas for indicators (Impacts und Responses) Pick up existing ideas for indicators /but also critical reflection: • change of outflow (I) • forest damages (I) • Incidence of FSME (I) • number of death people due to heat (I) • progress in forest conversion (R) • Flood protection Investments (R) • expansion of information services for floods and low tides (R) Refine ideas for indicators and discuss new ideas: • Condtions of composition (thermal layering) in lakes (I) • link-up of local networks in the drinking water supply (networks of waterworks) (R) • Structure of Energy supply (development of redundances) (R) • „cooling elements in the landscape (R)
Message from one member state • methodological consistency • Effective reporting structures
Thank you! www.anpassung.net kompass@uba.de
Indicator Factsheet Data Factsheet Documentation of Documentation of Parameter 1 and the related data sources Raw data set 1 Indicator A Indicator calculated from: Parameter 1 Data Factsheet Parameter 2 Documentation of Parameter 2 and the related data sources Raw data set 2 Parameter 3 Indicator Factsheet Documentation of Data Factsheet Indicator B Raw data set 3 Documentation of Parameter 3 and the related data sources Indicator calculated from: Parameter 3 Parameter 4 Data Factsheet Documentation of Parameter 4 and the related data sources Raw data set 4 Dokumentation Outlook: Step 4: Documentation of the indicators Tiered System of documentation
Anforderungen Vergangenheit und Zukunft Szenarische Aussagen und Prognosen eines Berichts müssen im Folge-bericht durch konkrete beobachtete / gemessene Daten belegt oder widerlegt werden.
Zum Beispiel: Modellierung zur Verän-derung inländischer touristischer Ankünfte in Deutschland infolge von Klimaveränderungen(Hamburg Tourism Model) Anforderungen Vergangenheit und Zukunft Welche Entwicklungen werden heute vorhergesagt? Werden diese Trends quantifiziert? Unterliegen die Ausgangsdaten der Modelle einer systematischen und langfristigen Beobachtung? Welche Daten bräuchten wir, um für die Zukunft modellierte Entwicklungen konkret nachvollziehen zu können?
Anforderungen Vergangenheit und Zukunft Risiks, Sensitivities, Vulnerability Isoard et al. zit. in EEA 2008
Zum Beispiel: Empfindlichkeit von Wäldern gegenüber flächenhafter Schädigung oder Absterben durch hohe Anteilestand-ortsfremder Fichten in heute bereits warm-trockenen Regionen Anforderungen Vergangenheit und Zukunft Empfindlichkeit und Verletzlichkeit Empfindlichkeit:Ist die aktuell anzutreffende Konstellation geeignet, im Falle des Eintreffens der vorhergesagten Klimaveränderung bestimmte Wirkungen („potential impacts“) hervorzurufen?
GHG in the Atmo-sphere Climate change Recovery Measures Responses Mitigation Adaptation Positionierung Pressures Drivers State Impacts Emissio-ns of GHG Lifestyle demands Activities,landuse pattern 14 sectors of the GAS Impacts on Water balance, Water management Impacts on human health Impacts on agriculture [...] Measures for the protection of endangered systems, for the development of potentials Mitigation measures Measures for the maintenance of sinks
Anforderungen Ebenen der Indikation Maßnahmen: „process“ und “outcome“ Maßnahmen werden durchgeführt Process-based indicators Durchgeführte ImpfkampagnenFSME Neufassung landwirtschaftlicher Anbauempfehlungen Investitionen in Biotopverbund-maßnahmen Impfrate FSME Anbau hitze- und trockenheitsresisten-ter Kulturen Anzahl von Querungshilfen Maßnahmen haben beabsich-tigte Wirkung Outcome-oriented indicators durch Impfkampagne reduzierte FSME-Inzidenz Erhöhung der landwirtschaftlichenErträge durch den vermehrten Anbau angepasster Kulturen und Sorten Zunahme der Populationsgrößen von Amphibien-arten durch erhöhte Anzahl von Querungshilfen Auswirkungen verändern sich. Impacts Inzidenzrate FSME Höhe des landwirtschaftlichen Ertrags Populationsgröße von Amphibienarten
Anforderungen Ebenen der Indikation Risiko Impacts Responses Zunahme der Präva-lenz von Allergien und Atopien Differenzierung von Pollenwarn-diensten Ausbreitung allergener Pflanzen,veränderte Blühzeiten allergener Pflanzen Zunahme flächen-hafter Waldschäden Waldumbau-maßnahmen Hohe Fichtenanteile im Klimabereich warm-trocken Prävalenz / Inzidenz von FSME Impfkampagnen, Impfrate Durchseuchungsraten von Zecken mit FSME-Viren
Sectors of the GAS Fields of indication Thematic part of an aspect Sub-aspects Chemical state of inland waters Eutrophication Impacts on sediment balance and structure Aim of the Structuring: not more than 10 to 12 fields of indication per sector Prioritisation is carried out at the level of fields of indication! Strukturierung (1) Scope adaptation Reproducable Scoping of the important impacts and responses for all sectors