Hardy Weinberg Equilibrium
850 likes | 1.02k Views
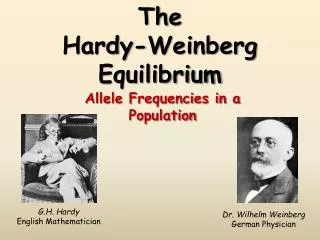
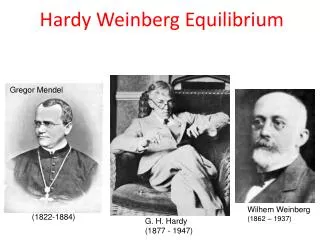
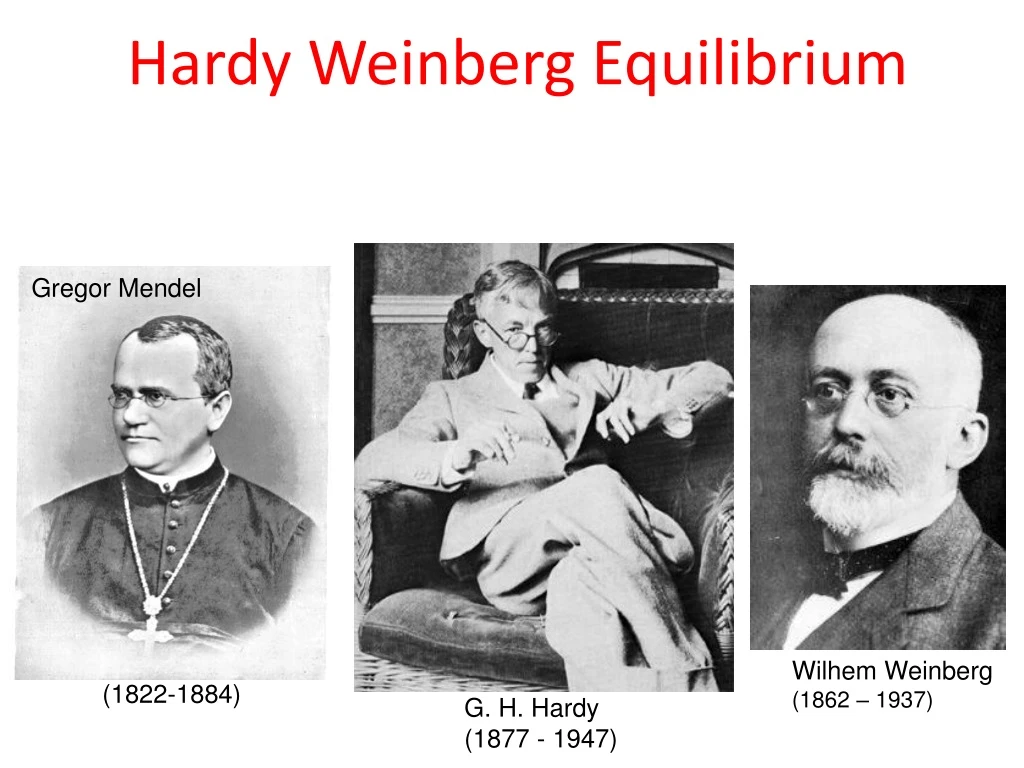
Gregor Mendel. Hardy Weinberg Equilibrium. Wilhem Weinberg (1862 – 1937). (1822-1884). G. H. Hardy (1877 - 1947). Lectures 4-12: Mechanisms of Evolution (Microevolution). Hardy Weinberg Principle ( Mendelian Inheritance) Genetic Drift Mutation Sex: Recombination and Random Mating

Hardy Weinberg Equilibrium
E N D
Presentation Transcript
Gregor Mendel Hardy Weinberg Equilibrium Wilhem Weinberg (1862 – 1937) (1822-1884) G. H. Hardy (1877 - 1947)
Lectures 4-12: Mechanisms of Evolution (Microevolution) • Hardy Weinberg Principle (Mendelian Inheritance) • Genetic Drift • Mutation • Sex: Recombination and Random Mating • Epigenetic Inheritance • Natural Selection These are mechanisms acting WITHIN populations, hence called “population genetics”—EXCEPT for epigenetic modifications, which act on individuals in a Lamarckian manner
Recall from Previous Lectures Darwin’s Observation Evolution acts through changes in allele frequency at each generation Leads to average change in characteristic of the population
Recall from Lecture on History of Evolutionary Thought Darwin’s Observation HOWEVER, Darwin did not understand how genetic variation was passed on from generation to generation
Gregor Mendel, “Father of Modern Genetics” http://www.biography.com/people/gregor-mendel-39282#synopsis • Mendel presented a mechanism for how traits got passed on “Individuals pass alleles on to their offspring intact” (the idea of particulate (genes) inheritance) Gregor Mendel (1822-1884)
Gregor Mendel, “Father of Modern Genetics” http://www.biography.com/people/gregor-mendel-39282#synopsis Mendel’s Laws of Inheritance • Law of Segregation • only one allele passes from each parent on to an offspring • Law of Independent Assortment • different pairs of alleles are passed to offspring independently of each other
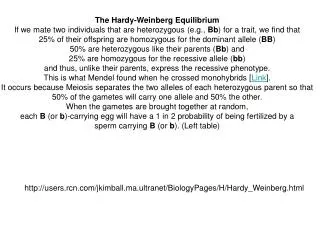
Using 29,000 pea plants, Mendel discovered the 1:3 ratio of phenotypes, due to dominant vs. recessive alleles • In cross-pollinating plants with either yellow or green peas, Mendel found that the first generation (f1) always had yellow seeds (dominance). However, the following generation (f2) consistently had a 3:1 ratio of yellow to green.
Mendel uncovered the underlying mechanism, that there are dominant and recessive alleles
Hardy-Weinberg Principle Mathematical description of Mendelian inheritance Jeremy Irons playing GH Hardy in the film “The Man Who Knew Infinity” ↓ Wilhem Weinberg (1862 – 1937) German obstetrician-gynecologist Godfrey H. Hardy (1877-1947) English Mathematician
Testing for Hardy-Weinberg equilibrium can be used to assess whether a population is evolving
The Hardy-Weinberg Principle • A population that is not evolving shows allele and genotypic frequencies that are in Hardy Weinberg equilibrium • If a population is not in Hardy-Weinberg equilibrium, it can be concluded that the population is evolving
Evolutionary Mechanisms (will put population out of HW Equilibrium): • Genetic Drift • Natural Selection • Mutation • Migration *Epigenetic modifications change expression of alleles but not the frequency of alleles themselves, so they won’t affect the actual inheritance of alleles However, if you count the phenotype frequencies, and not the genotype frequencies , you might see phenotypic frequencies out of HW Equilibrium due to epigenetic silencing of alleles. (epigenetic modifications can change phenotype, not genotype)
Requirements of HWEvolution Violation Large population size Genetic drift Random MatingInbreeding & other No MutationsMutations No Natural SelectionNatural Selection No Migration Migration An evolving population is one that violates Hardy-Weinberg Assumptions
Fig. 23-5a MAP AREA CANADA ALASKA • What is a “population?” • A group of individuals within a species that is capable of interbreeding and producing fertile offspring • (definition for sexual species) Beaufort Sea NORTHWEST TERRITORIES Porcupine herd range Fortymile herd range YUKON ALASKA
In the absence of Evolution… Patterns of inheritance should always be in “Hardy Weinberg Equilibrium” Following the transmission rules of Mendel
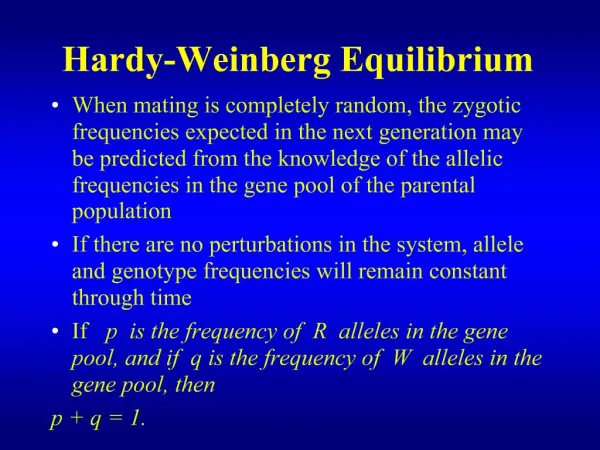
Hardy-Weinberg Equilibrium • According to the Hardy-Weinberg principle, frequencies of alleles and genotypes in a population remain constant from generation to generation • Also, the genotype frequencies you see in a population should be the Hardy-Weinberg expectations, given the allele frequencies
“Null Model for No Evolution” • A population in Hardy-Weinberg Equilibrium serves as the Null Model (for no evolution) to test if evolution is happening
Example: Is this population in Hardy Weinberg Equilibrium? • AA Aaaa • Generation 1 0.25 0.50 0.25 • Generation 2 0.20 0.60 0.20 • Generation 3 0.10 0.80 0.10
Hardy-Weinberg Theorem In a non-evolving population, frequency of alleles and genotypes remain constantover generations You should be able to predict the genotype frequencies, given the allele frequencies
important concepts • gene: A region of genome sequence (DNA or RNA), that is the unit of inheritance , the product of which contributes to phenotype • locus: Location in a genome (used interchangeably with “gene,” if the location is at a gene… but, locus can be anywhere, so meaning is broader than gene) • loci: Plural of locus • allele: Variant forms of a gene (e.g. alleles for different eye colors, BRCA1 breast cancer allele, etc.) • genotype: The combination of alleles at a locus (gene) • phenotype: The expression of a trait, as a result of the genotype and regulation of genes (green eyes, brown hair, body size, finger length, cystic fibrosis, etc.)
important concepts • allele: Variant forms of a gene (e.g. alleles for different eye colors, BRCA1 breast cancer allele, etc.) • We are diploid (2 chromosomes), so we have 2 alleles at a locus (any location in the genome) • However, there can be many alleles at a locus in a population. • For example, you might have inherited a blue eye allele from your mom and a brown eye allele from your dad… you can’t have more alleles than that (only 2 chromosomes, one from each parent) • BUT, there could be many alleles at this locus in the population, blue, green, grey, brown, etc.
A2 A1 Eggs A3 A1 A2 A1 A4 • Alleles in a population of diploid organisms A2 A1 A3 Sperm A4 A1 A1 Random Mating (Sex) A1A1 A1A1 Zygotes A1A3 A1A1 • Genotypes A2A4 A3A1
A2 A1 Eggs A3 A1 A2 A1 A4 So then can we predict the % of alleles and genotypes in the population at each generation? A2 A1 A3 Sperm A4 A1 A1 A1A1 A1A1 Zygotes A1A3 A1A1 A2A4 A3A1
Hardy-Weinberg Theorem In a non-evolving population, frequency of alleles and genotypes remain constantover generations
Fig. 23-6 Alleles in the population Frequencies of alleles Gametes produced p = frequency of Each egg: Each sperm: CR allele = 0.8 q = frequency of 80% chance 80% chance 20% chance 20% chance CW allele = 0.2 Hardy-Weinberg proportions indicate the expected allele and genotype frequencies, given the starting frequencies
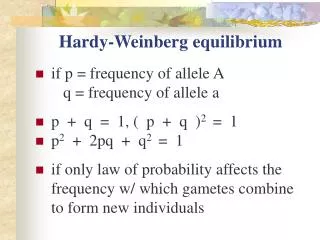
By convention, if there are 2 alleles at a locus, p and q are used to represent their frequencies • The frequency of all alleles in a population will add up to 1 • For example, p + q = 1
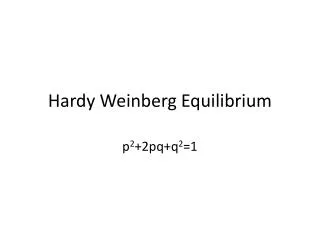
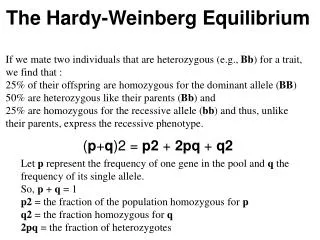
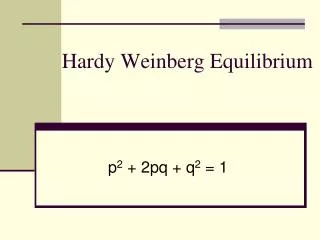
If p and q represent the relative frequencies of the only two possible alleles in a population at a particular locus, then for a diploid organism (2 chromosomes), (p + q) 2 = 1 = p2 + 2pq + q2 = 1 • where p2 and q2 represent the frequencies of the homozygous genotypes and 2pq represents the frequency of the heterozygous genotype
What about for a triploid organism? • (p + q)3 = 1 = p3 + 3p2q+ 3pq2 + q3 = 1 Potential offspring: ppp, ppq, pqp, qpp, qqp, pqq, qpq, qqq How about tetraploid? You work it out.
Hardy Weinberg Theorem ALLELES Probability of A= pp+ q= 1 Probability of a= q GENOTYPES AA: pxp= p2 Aa: pxq+ qxp= 2pq aa:qxq= q2 p2+ 2pq+ q2 = 1
More General HW Equations • One locus three alleles: (p + q + r)2 = p2 + q2 + r2 + 2pq +2pr + 2qr • One locus n # alleles: (p1 + p2 + p3 + p4 … …+ pn)2 = p12 + p22 + p32 + p42… …+ pn2 + 2p1p2 + 2p1p3 + 2p2p3 + 2p1p4 + 2p1p5 + … … + 2pn-1pn • For a polyploid (more than two chromosomes): (p + q)c, where c = number of chromosomes • If multiple loci (genes) code for a trait, each locus follows the HW principle independently, and then the alleles at each loci interact to influence the trait
ALLELE Frequencies Frequency of A = p = 0.8 Frequency of a = q = 0.2 • p + q = 1 Expected GENOTYPE Frequencies AA: pxp = p2 = 0.8 x 0.8 = 0.64 Aa: pxq + qxp = 2pq = 2 x (0.8 x 0.2) = 0.32 aa: qxq = q2 = 0.2 x 0.2 = 0.04 p2 + 2pq + q2 = 0.64 + 0.32 + 0.04 = 1 Allele frequencies remain the same at next generation • Expected Allele Frequencies at 2nd Generation • p = AA + Aa/2 = 0.64 + (0.32/2) = 0.8 • q = aa + Aa/2 = 0.04 + (0.32/2) = 0.2
Hardy Weinberg Theorem ALLELE Frequency Frequency of A = p = 0.8 p + q = 1 Frequency of a = q = 0.2 Expected GENOTYPE Frequency AA: pxp = p2 = 0.8 x 0.8 = 0.64 Aa: pxq + qxp = 2pq = 2 x (0.8 x 0.2) = 0.32 aa : qxq = q2 = 0.2 x 0.2 = 0.04 p2 + 2pq + q2 = 0.64 + 0.32 + 0.04 = 1 Expected Allele Frequency at 2nd Generation p = AA + Aa/2 = 0.64 + (0.32/2) = 0.8 q = aa + Aa/2 = 0.04 + (0.32/2) = 0.2
Similar example, But with different starting allele frequencies q p
p2 2pq q2
Calculating Allele Frequencies from # of Individuals • The frequency of an allele in a population can be calculated from # of individuals: • For diploid organisms, the total number of alleles at a locus is the total number of individuals x 2 • The total number of dominant alleles at a locus is 2 alleles for each homozygous dominant individual • plus 1 allele for each heterozygous individual; the same logic applies for recessive alleles
Calculating Allele and Genotype Frequencies from # of Individuals AA Aa aa 120 60 35 (# of individuals) #A = (2 x AA) + Aa = 240 + 60 = 300 #a = (2 x aa) + Aa = 70 + 60 = 130 Proportion A = 300/total = 300/430 = 0.70 Proportion a = 130/total = 130/430 = 0.30 A + a = 0.70 + 0.30 = 1 Proportion AA = 120/215 = 0.56 Proportion Aa = 60/215 = 0.28 Proportion aa = 35/215 = 0.16 AA + Aa + aa = 0.56 + 0.28 +0.16 = 1
Applying the Hardy-Weinberg Principle • Example: estimate frequency of a disease allele in a population • Phenylketonuria (PKU) is a metabolic disorder that results from homozygosity for a recessive allele • Individuals that are homozygous for the deleterious recessive allele cannot break down phenylalanine, results in build up mental retardation
The occurrence of PKU is 1 per 10,000 births • How many carriers of this disease in the population?
Rare deleterious recessives often remain in a population because they are hidden in the heterozygous state (the “carriers”) • Natural selection can only act on the homozygous individuals where the phenotype is exposed (individuals who show symptoms of PKU) • We can assume HW equilibrium if: • There is no migration from a population with different allele frequency • Random mating • No genetic drift • Etc
So, let’s calculate HW frequencies • The occurrence of PKU is 1 per 10,000 births (frequency of the disease allele): q2 = 0.0001 q = sqrt(q2 ) = sqrt(0.0001) = 0.01 • The frequency of normal alleles is: p = 1 – q= 1 – 0.01 = 0.99 • The frequency of carriers (heterozygotes) of the deleterious allele is: 2pq = 2 x 0.99 x 0.01 = 0.0198 or approximately 2% of the U.S. population
Conditions for Hardy-Weinberg Equilibrium • The Hardy-Weinberg theorem describes a hypothetical population • The five conditions for nonevolving populations are rarely met in nature: • No mutations • Random mating • No natural selection • Extremely large population size • No gene flow • So, in real populations, allele and genotype frequencies do change over time
DEVIATION from Hardy-Weinberg Equilibrium Indicates that EVOLUTION Is happening
Hardy-Weinberg across a Genome • In natural populations, some loci might be out of HW equilibrium, while being in Hardy-Weinberg equilibrium at other loci • For example, some loci might be undergoing natural selection and become out of HW equilibrium, while the rest of the genome remains in HW equilibrium
How can you tell whether a population is out of HW Equilibrium?
Perform HW calculations to see if it looks like the population is out of HW equilibrium • Then apply statistical tests to see if the deviation is significantly different from what you would expect by random chance
Example: Does this population remain in Hardy Weinberg Equilibrium across Generations? • AA Aaaa • Generation 1 0.25 0.50 0.25 • Generation 2 0.20 0.60 0.20 • Generation 3 0.10 0.80 0.10
AA Aaaa Generation 1 0.25 0.50 0.25 Generation 2 0.20 0.60 0.20 Generation 3 0.10 0.80 0.10 • In this case, allele frequencies (of A and a) did not change. • ***However, the population did go out of HW equilibrium because you can no longer predict genotypic frequencies from allele frequencies • For example, p = 0.5, p2 = 0.25, but in Generation 3, the observe p2 = 0.10