Download

1 / 11
110 likes | 161 Views
Learn about genetic equilibrium in populations, the gene pool composition, allele frequencies, traits variation, and factors causing variations. Explore Hardy-Weinberg equilibrium and conditions for non-evolution.

E N D
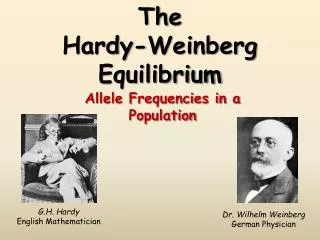
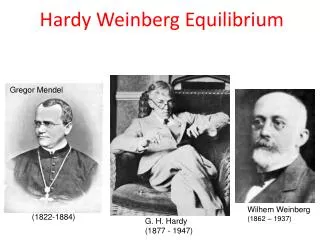
HARDY-WEINBERG and GENETIC EQUILIBRIUM CH. 16-1 PP 317-320
The Gene Pool • Population – group of the same species living in the same area.
The Gene Pool • In a population, organisms tend to show small variations of a trait • EX: __________________
The Gene Pool • In a population, organisms tend to show small variations of a trait • EX: __________________ • Gene Pool- total genetic information stored in a population • EX: __________________
The Gene Pool • In a population, organisms tend to show small variations of a trait • EX: __________________ • Gene Pool- total genetic information stored in a population • EX: __________________ • Allele frequency- Each allele exists at a certain frequency • EX: __________________
Variation of Traits in a Population • Histogram- graph showing frequencies of each trait. Usually displays a bell curve.
Variation of Traits in a Population • Histogram- graph showing frequencies of each trait. Usually displays a bell curve. • Bell Curve – shows that most members of a population have a similar variation of a trait. Only a few individuals display extreme variations of the trait. EX: A few fish are very short and a few are very long, most are of average length
WHAT CAUSES THESE VARIATIONS? • Mutations- Random change in DNA passed to offspring
WHAT CAUSES THESE VARIATIONS? • Mutations- Random change in DNA passed to offspring • Recombination- reshuffling of genes during Meiosis • Independent assortment • crossing over
VARIATION OF TRAITS IN A POPULATION • Mutations- Random change in DNA passed to offspring • Recombination- reshuffling of genes during Meiosis • Independent assortment • crossing over • Random pairing of gametes
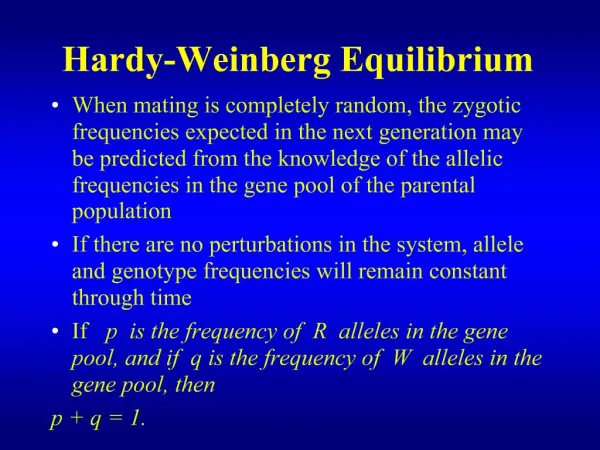
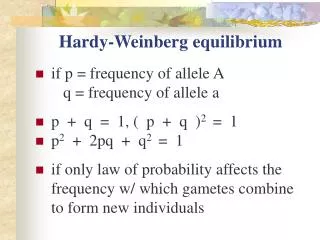
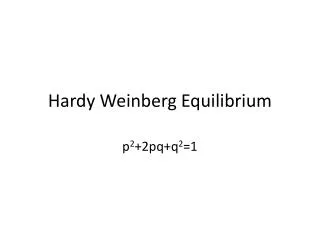
Hardy-Weinberg Genetic Equilibrium • Hardy-Weinberg equilibrium describes populations that are not evolving • Genotype frequencies stay the same over time as long as certain conditions are met: • Very large populations • No emigration or immigration • No mutations • Random mating • No natural selection