Download
1 / 26
260 likes | 295 Views
Explore the dynamic changes in Larsen B Ice Shelf using MODIS and ICESat data, revealing significant glacier shifts and elevation variations. Learn about repeat track assessments and cloud impacts affecting data quality.

E N D
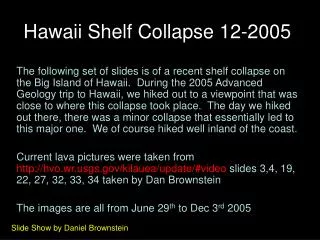
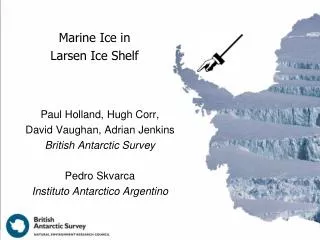
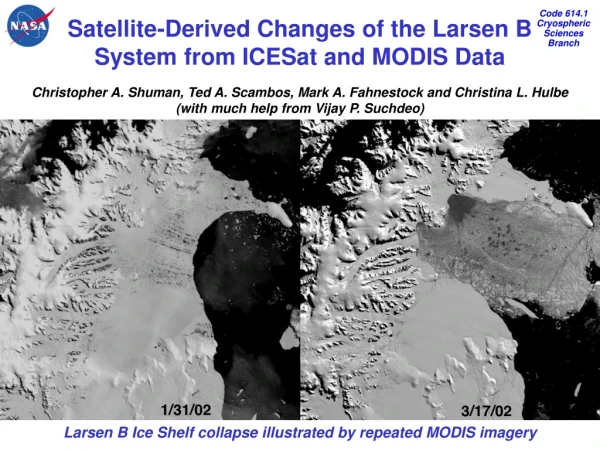
Satellite-Derived Changes of the Larsen B System from ICESat and MODIS DataChristopher A. Shuman, Ted A. Scambos, Mark A. Fahnestock and Christina L. Hulbe(with much help from Vijay P. Suchdeo) Larsen B Ice Shelf collapse illustrated by repeated MODIS imagery
ICESat ‘Repeat Track’ Elevation Changes (a) Landsat 7 image from Feb. 20 2003, with shot point locations from three ICESat tracks overlain. Contours are ice speed difference in m/day between Landsat image pairs (Dec. 6 2001 – Apr. 6 2002 and Dec. 18 2002 – 20 Feb. 20 2003. Valid elevation locations are shown as red dots. Blue bars connect three elevations along a flowline. Net elevation difference relative to our estimate is shown as text. (b) ICESat elevation profiles projected up-flow. Red circles are sized to the estimated elevation error of ±6 m. We estimate a ±6 m error based on the average along-track elevation differences from smoothed versions of the two earlier profiles filtered at 2.4 km (the spacing between the two outer profiles). (Scambos et al, Glacier acceleration and thinning after ice shelf collapse in the Larsen B embayment, Antarctica, GRL 2004).The Crane Glacier just to the south also shows a >60 m elevation loss and ice front retreat of >6 km between Nov. 26, 2002 and Nov. 29, 2004 long-range airborne lidar surveys (unpublished data from Thomas et al., NASA GSFC WFF)
ICESat 8-day Data - Laser 1 and Laser 2a Hektoria Glacier Larsen B collapse area Hektoria Glacier elevation changes from 8-day data, with ~2.4 km offset, ±6 m uncertainty
ICESat Crossover Data - Laser 2a and Laser 2b Only 6 crossovers produced during longest operations period (L2a), and 4 during typical ~33-day operations period (L2b). Thus, repeat track assessments are necessary for change detection.
ICESat Coverage and Cloud Assessment Note that the cloud assessment applies to the whole profile across the Larsen B embayment and is in part qualitative. As with the 8-day data used in Scambos et al., 2004, some useful elevations may exist in ‘scattered or partial’ profiles. The Laser 3e data in the area was compromised by (at least) two days of heavy clouds in the area.
ICESat Partial 91-Day Near-Repeat Time Series 0137 0018 0129 0390 0010
Track 0129 - Crane Glacier Tongue Collapse Looking East, Down Glacier
Track 0129 - Crane Glacier Tongue Collapse Crane Glacier Tongue Collapse Oct. 03 to Mar. 04 For Ross Ice Shelf, h = 0.104*H + 15.5 (errors on m and b: 0.004 and 2.6) and h = ~75 so H for Crane = 572m ± ~5m (after Bamber and Bentley, 1994) but Crane likely more ice - less firn so H could be ~900 m Looking East, Down Glacier
ICESat Track 0018 - Flask and Leppard, Larsen B Significant differences in ice surface roughness between Oct. 03 and Feb. 04 tracks Looking East, Down Flow
ICESat Track 0137 - Green Glacier Green Glacier ElevationChange Mar. 04 to Nov. 05 Looking East, Down Glacier
ICESat Track 0129 - Green Glacier Green Glacier ElevationChange? Oct. 03 to June 04 Looking East, Down Glacier
ICESat Track 0129 - Green Glacier Green Glacier Trib. L2a - east of ref. track L2b - ~on ref. track L2c - west of ref. track Green Glacier Track 0129 repeat passes move successively west - upslope
Cross Track Slope - Cause of Elevation ‘Increase’ Nearest shot pair distances are typically close to 100 m but shots must be compared along the flow direction and slope correction made for that distance Illustrates possible magnitude of cross track slope and separation on unchanging surface elevations
ICESat Track 0129 - Pequod, Starbuck Glaciers Pequod, StarbuckGlacier ElevationChange? Oct. 03 to Feb. 05 Looking East, Down Glacier Pequod Terminus - T. Scambos
Siple Dome - Track 0087 - Cloud Impact Forward scattering delays and thus effectively ‘lowers’ the surface (most impacts are meter level and below Repeat track analysis shows uncommon cloud forward scattering magnitude
Summary - Larsen B From MODIS and ICESat Ice shelf margins and glaciers in the Larsen B catchment continue to change significantly following the major shelf breakup in early 2002 MODIS image data can be used to assess ice shelf area changes and to locate ICESat repeat tracks relative to specific glaciers ICESat repeat tracks (8 ~33-day operations periods through early 2006) can be used to estimate elevation changes for specific glaciers but most glaciers will have less than 8 profiles Repeat track analyses can be significantly complicated by cross-track offsets on sloping ice surfaces Comparison of repeat track elevations should be made along flow The area is fairly cloudy and clouds can prevent elevation retrieval and also cause elevation impacts (laser pulse forward scattering, significant impacts are possible) that obscure real elevation changes Quantifying elevation change is possible but requires careful analysis to identify and compensate for the factors above For more information, please see… http: //icesat.gsfc.nasa.gov and http://nsidc.org/data/icesat/
Siple Dome - Track 0087 - Cloud Impact SDM - thick clouds to north ‘mostly’ clear Siple Dome