Download
1 / 34
340 likes | 450 Views
Utilize QA browse tool with 39 km resolution global maps for Ocean products. Access histograms, time series plots, and download HDF files for data analysis. Includes processing QA for ongoing improvements in ocean data quality.

E N D
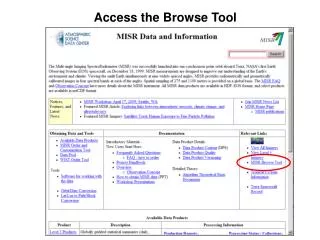
MODIS OCEAN QA Browse Imagery (MQABI Browse Tool) NASA Goddard Space Flight Center Sept 4, 2003 http://jeager.gsfc.nasa.gov/browsetool/
MQABI/QAPS Team Kevin Turpie - technical lead, statistics, graphics software Aumber Bhatti - web site and system software Donna Thomas - L2 graphics and operations support Ron Vogel - time series graphics
MQABI as a portal to MODIS Ocean Data • QA browse tool provides access to 39 km resolution global maps for all Ocean products as they are produced in forward and reprocessing streams. • Temporal resolutions of daily, weekly, monthly, and yearly • Images filtered for each quality level (best, good, fair, all) • Quality level map image (spatial distribution of quality levels)
MQABI Data analysis tools • Histograms of data for all quality levels for nominal range statistics for global maps (all temporal resolutions) • Full range statistics of all quality levels for global maps • Time series statistics (weekly, monthly) for global and 16 oceanographic regions (all quality levels) • Time series plots of weekly means (select parameters) • Toggle global images between different quality levels • Download Level 3 Mean and Quality HDF files directly from the web site • Time Series movie loop feature (display successive images), Movie maker feature (create a movie and download it)
MODIS Ocean QA Website modis-ocean.gsfc.nasa.gov/qa • Access to browse tool • Data Quality Summaries • Known Problems • Quality Level Flags
All parameters displayed (weekly 39 km images) Thumbnail GIFs are QL = 0 Pull down menu for each product has links to stats Click on each individual product in the View All Page and you get a pop up image that has direct links to GDAAC to order data for that product, for any resolution and map type
Order from GDAAC 4km, 36km, 1 degree resolution: Common Flags, Std. Deviation, Number of Observations, Mean, Quality Map for this product and this data date
From daily to weekly to monthly, lower quality levels are not included in the binning average, unless that’s all that’s available. Results in more complete coverage at better quality.
Time series statistics are calculated for global maps and 17 oceanographic regions 15 regions modified from Watson Gregg Open ocean and coastal regions: > 1000m isobath <= 1000m isobath
All Chlorophyll time series plots also include SeaWiFS chlorophyll on the same plot
Chlorophyll time series Overview page of all regions
Terra Mission Time Series: overview of the data values for the entire mission North Atlantic weekly chlorophylls QL=0-1 Global weekly water-leaving radiances QL=0
Aqua Primary Productivity Time series
Aspects of QA • Run-time QA: automatic setting of QL flags at pixel level, internal to the code • Processing QA: Using 39 km maps, identify problems and track down system errors or processing code errors. Every single parameter (imagery and statistics) is viewed for daily weekly, monthly, yearly files as they are produced. • Science QA: calibration relevant to ocean radiances, analysis of upstream products impacting downstream, refinement of algorithms, validation against in-situ measurements - ongoing by U.Miami and individual algorithm scientists
Conclusion • Much information for data analysis already resides on the web at MQABI http://jeager.gsfc.nasa.gov/browsetool/ • Images of 39 km maps, statistics, time series (text listing and plots), and movie loops are available • Mean and Quality HDF files can be downloaded • MQABI dual use: a browse tool for the science community and for routine processing QA • QA web page contains Data Quality Summaries, Known Problems, and many other documents http://modis-ocean.gsfc.nasa.gov/qa