Chapter 2: The Normal Distributions
Chapter 2: The Normal Distributions. Section 2.1: Density curves and the Normal Distributions. Chapter 1 gave a strategy for exploring data on a single quantitative variable. Make a graph. Usually a histogram or stemplot Describe the distribution.

Chapter 2: The Normal Distributions
E N D
Presentation Transcript
Section 2.1: Density curves and the Normal Distributions • Chapter 1 gave a strategy for exploring data on a single quantitative variable. • Make a graph. • Usually a histogram or stemplot • Describe the distribution. • Shape, center, spread, and any striking deviations. • Calculate numerical summaries to briefly describe the center and spread. • Mean and standard deviation for symmetric distributions • Five-number summary for skewed distributions
Density Curves • Chapter 2 tells us the next step. • If the overall pattern of a large number of observations is very regular, describe it with a smooth curve. • This curve is a mathematical model for the distribution. • Gives a compact picture of the overall pattern. • Known as a density curve.
Density Curves • A density curve describes the overall pattern of a distribution. • Is always on or above the horizontal axis. • The area under the curve represents a proportion. • Has an area of exactly 1 underneath it. • The median of a density curve is the equal-areas point. • Point that divides the area under the curve in half. • The quartiles divide the area into quarters • ¼ of the area is to the left of Q1 • ¾ of the area is to the left of Q3 • The mean of a density curve is the balance point. • Point that the curve would balance at if made of solid material.
Mathematical Model • A density curve is an idealized description of the distribution of data. • It gives a quick picture of the overall pattern ignoring minor irregularities as well as outliers • Since a density curve is an idealized description of the data (not the actual data), we need to differentiate between the mean and standard deviation of the curve and the mean and standard deviation of the actual observations.
Normal distributions: • Normal curves • Curves that are symmetric, single-peaked, and bell-shaped. They are used to describe normal distributions. • The mean is at the center of the curve. • The standard deviation controls the spread of the curve. • The bigger the St Dev, the wider the curve. • There are roughly 6 widths of standard deviation in a normal curve, 3 on one side of center and 3 on the other side.
Here are 3 reasons why normal curves are important in statistics. • Normal distributions are good descriptions for some distributions of real data. • Normal distributions are good approximations to the results of many kinds of chance outcomes. • Most important is that many statistical inference procedures based on normal distributions work well for other roughly symmetric distributions.
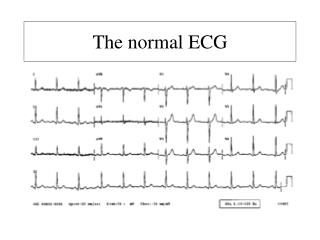
The 68-95-99.7 rule or Empirical rule: • 68% of the observations fall within one standard deviation of the mean. • 95% of the observations fall within two standard deviation of the mean. • 99.7% of the observations fall within three standard deviation of the mean.
61.5 64 66.5 69 71.5 74 76.5
2.5% 95% 2.5% 61.5 64 66.5 69 71.5 74 76.5
2.5% 64 to 74 in 95% 61.5 64 66.5 69 71.5 74 76.5
2.5% 64 to 74 in 16% 68% 16% 61.5 64 66.5 69 71.5 74 76.5
2.5% 64 to 74 in 16% 84% 34% 68% 50% 61.5 64 66.5 69 71.5 74 76.5
Normal distribution notation • Since normal distributions are so common, a short notation is helpful • Abbreviate the normal distribution with mean and standard deviation as: • The distribution of men’s heights would be
Find the proportion of observations within the given interval 1.0 • P(0 <X <2) • P(.25 <X < .5) • P(.25 < X <.75) • P(1.25 <X <1.75) • P(.5 < X < 1.5) • P(1.75 <X < 2) .75 .5 .25 0 0 .25 .5 .75 1.0 1.25 1.5 1.75 2.0 • = 1.0 • = .125 • = .25 • = .25 • = .46875 • = .15625
Section 2.1 Complete • Homework: p.83-91 #’s 2-4, 9, 12 & 14