Flood Risk Mapping Project Identifying the Risk
140 likes | 517 Views
Flood Risk Mapping Project Identifying the Risk. Editorial Board Meeting. [COMMUNITY NAME] Flood Risk Mapping Project. Risk MAP. Risk Mapping, Assessment and Planning FEMA’s nationwide effort to provide updated flood risk information and tools to communities

Flood Risk Mapping Project Identifying the Risk
E N D
Presentation Transcript
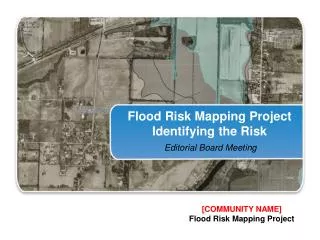
Flood Risk Mapping ProjectIdentifying the Risk Editorial Board Meeting [COMMUNITY NAME] Flood Risk Mapping Project
Risk MAP • Risk Mapping, Assessment and Planning • FEMA’s nationwide effort to provide updated flood risk information and tools to communities • Communities then use this information to enhance local mitigation plans and better protect citizens from flooding • Strengthens ability to make informed decisions about reducing flood risk • Enhances ability to communicate flood risk to residents and business owners
Flood Risks Have Changed • Flooding is one of [community name]’smost costly natural disasters • Water flow and drainage patterns have changed over time due to erosion, land-use & natural forces • [flood fact: e.g. Flood season of 2005 showed the need for new maps; more than 50 percent of flooded properties in moderate and low risk areas] • This study integrates most current [rainfall, elevation, hydrology, etc.] data with latest digital modeling and mapping technologies to produce more detailed, reliable [Internet accessible, if applicable] data
National Flood Insurance Program • Established in 1968 by Congress • Basic Components • Identifies and maps flood-prone communities • Requires that communities adopt and enforce floodplain management regulations • Provides flood insurance • Over 21,000 participating communities nationwide* • 5.6 million policyholders nationwide* • $1.23 billion in coverage*
[Community name] Flood Facts [insert local flood facts below] • Joined NFIP [month, year] • Joined NFIP’s Community Rating System (CRS) in [date,if applicable] • Policyholders now receive up to [#]percent premium discount due to county’s additional efforts • Over [total # of properties]properties insured • Nearly[total $ amount]of property covered • More than [total $ amount]in losses paid by the NFIP • First flood map: [year] • Last map update: [year] • Last detail study done in this area in [year]
[Community name] Floodplains [insert local floodplain information – examples below] • County’s flooding occurs not only along the coast, but in riverine and inland areas too • County’s 17 watersheds are complex; 300 additional stream miles included • Entire county re-mapped, except for coastal and incorporated areas • Flood risk can vary neighborhood to neighborhood; property to property
Benefits of Update Flood Risk Information • Improves safety of individuals and property • Improved data allows for more informed decisions for key stakeholders • Builders, Developers, Surveyors & Engineers • Community Officials • Real Estate Agents & Lenders • Insurance Agents & Companies • Business Owners • Home Owners and Renters
Estimated Impact [Example New DFIRM or Changes Since Last Map Tool] • [total #]parcels mapped out of high-risk area • [total #]parcels mapped into high risk area • [total #]parcels remain in high-risk area • [total #]parcels remain in moderate- to low-risk areas
Timeline • Milestones • Official Presentation of Preliminary Maps – [date] • Media briefing is held • Public Outreach [month- month] [describe below what is being done; e.g.] • [Digital maps go up on Web site] • [Affected residents mailed letters] • [Two public meetings; nearby public libraries set up to answer questions] • 90-day Public Comment Period • Begins[date] • Ends [date] • Letter of Final Determination Issued – [season; e.g. Spring 2014] • Maps Become Effective – (anticipated) [season; e.g. Fall 2014] • New flood insurance requirements become effective
Advice to Property Owners • Everyone is at risk of flooding • Know and understand your flood risk • Contact your insurance agent to learn your options • Visit[enter URL]to learn specific information about possible changes to your property • Attend[identify meetings/information sessions; e.g. Public Meetings and Library Open Houses] to ask questions
Increasing Public Awareness • Launched County-wide Outreach and Education Effort • Active participation of stakeholder advisory group • Hosting public meetings • Conducting informational mailing • Developed multiple information/assistance resources • Created Public Service Announcements • Engaging news media [Describe what is being done to inform the public; example below]
Public Information Resources • [enter local/county URL] • [Call Center; phone number] • [hours of operation] • [its purpose; e.g. general information] • FEMA.gov/plan/prevent/fhm (FEMA mapping site) • FloodSmart.gov (flood insurance information; find an agent) • FEMA Map Information eXchange (FMIX) 1-877-FEMA-MAP • Specific mapping questions
Summary • New flood hazard maps = safer [community name] • Current flood risk data allows for more informed decisions • Proactive outreach means the public will know where to go for more information and will know their options • Enrolled community partners in a collaborative approach to educate the public