Download
1 / 22
220 likes | 235 Views
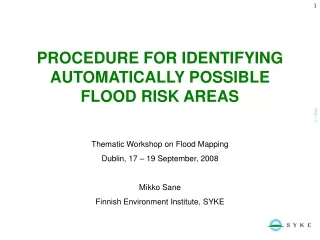
PROCEDURE FOR IDENTIFYING AUTOMATICALLY POSSIBLE FLOOD RISK AREAS Thematic Workshop on Flood Mapping Dublin, 17 – 19 September, 2008 Mikko Sane Finnish Environment Institute, SYKE. Why the Preliminary Flood Risk Assessment is important to Finland?.

E N D
PROCEDURE FOR IDENTIFYING AUTOMATICALLY POSSIBLE FLOOD RISK AREAS Thematic Workshop on Flood Mapping Dublin, 17 – 19 September, 2008 Mikko Sane Finnish Environment Institute, SYKE
Why the Preliminary Flood Risk Assessment is important to Finland? • The amount of flood damages has been small in Finland • The country is sparsely populated • 338 000 km2 • 17 inhabitants/km2 • The compilation of flood maps for “the whole country” would be a huge task • It is important to start the flood risk management process with the identification of sites where flood can cause damage (PFRA) • The identified areas will be presented on flood hazard and flood risk maps
Procedure for identifyingflood prone areas • Semi-automatic raster-based GIS-method • Can be used as a tool in the PFRA • Generated flood prone area (blue) is modelled in a catchment scale using digital elevation model (DEM) and geographical information (GI) data of water body • Calculations are based on upper drainage area, lake percentage and river gradient • The model is calibrated using discharge and water level observations (e.g. return period 1/250a) • Can be identified floodplains and flood water retention areas too • The accuracy of the DEM has a fundamental influence on the accuracy of the generated flood prone areas
How to identifythe significantflood risk areas? • Generated flood prone area can be overlaid with flood vulnerability receptors in GIS, e.g. with the built-up environment class of CORINE land cover GI-data • Can be identified the possible flood risk areas (red) in a coarse scale
Using the risk square and zone methodology for identifying the significant flood risk areas • Used for emergency planning in Finland • 250 x 250 m squares • Based on the proved relation between building fires and number of inhabitants and floor areas of buildings • Could be applied for identifying the significant flood risk areas • Also other parameters could be used • The ranges of the risk squares should be reclassified • A risk zone: at least 10 risk-squares next to each other belong to the same or higher risk class
The significant flood risk areas? Areas to be floodmapped?
The information about the risk squares are presented as numeric values in the GIS-attribute-table • flood depth zone • number of inhabitants with risk class • floor area with risk class • total risk class • total number of buildings • numbers of buildings classed according to the purpose of use • Statistic from the whole catchment can becalculated too
PFRA in Finland: process • Analysis of the existing GI-data together with the generated “flood prone” area (carried out in catchment scale) • Use of the other existing information and general knowledge about flood risk areas together with results of the GIS-analysis • Selection of the potential significant flood risk areas • Reporting (in catchment scale) • Reporting (in WFD river basin district scale)
Implementing of the preliminary flood risk assessment in Finland EU WISE Flood observations and historic flood maps Flood information system of environmental administration Generated flood prone areas + flood risk analyse and parameters (inhabitants and buildings) GI-data: Boundaries of the areas to be floodmapped Identify possible flood risk areas Metadata Earlier reports etc. Maps Geographic information data and databases of environmental administration Report
Discussion and conclusion • There are some open questions: • What is the criterion for the selection of the significant flood risk areas? • It should be a national decision • What return period should be used in calibration? • It’s better to overestimate than underestimate to flood • The accuracy of the DEM has a fundamental influence on the flood prone area modelling • The algorithm can be used for identifying floodplain areas and temporary flooding areas too • The use of GIS will be extensive in PFRA … • …but also the old knowledge about flood risk areas will be taken into account • the final decision of selecting the significant flood risk areas is made bythe experts of the regional environments centres • The data and knowledge collected in the PFRA process is very important for the preparation of the flood risk management plans