Chapter 1: Exploring Data
Chapter 1: Exploring Data. Section 1.1 Analyzing Categorical Data. The Practice of Statistics, 4 th edition - For AP* STARNES, YATES, MOORE. Categorical Variables place individuals into one of several groups or categories.

Chapter 1: Exploring Data
E N D
Presentation Transcript
Chapter 1: Exploring Data Section 1.1 Analyzing Categorical Data The Practice of Statistics, 4th edition - For AP* STARNES, YATES, MOORE
Categorical Variables place individuals into one of several groups or categories. *The values of a categorical variable are labels for the different categories, such as “male” and “female.” *The distribution of a categorical variable lists the count or percent of individuals who fall into each category.
Example 1: The radio audience rating service Arbitron places the country’s 13,838 radio stations into categories that describe the kinds of programs they broadcast. Here are two different tables showing the distribution of station formats: Variable Values Count Percent
In this case, the individuals are the radio stations and the variable being measured is the kind of programming that each station broadcasts. The table on the left, which we call a frequency table, displays the counts (frequencies) of stations in each format category. On the right, we see a relative frequency table of the data that shows the percents(relative frequencies) of stations in each format category. It’s a good idea to check data for consistency. The counts should add to 13,838, the total number of stations. They do. The percents should add to 100%. In fact, they add to 99.9%. What happened? Each percent is rounded to the nearest tenth. The exact percents would add to 100, but the rounded percents only come close. This is roundoff error. Roundoff errors don’t point to mistakes in our work, just to the effect of rounding off results.
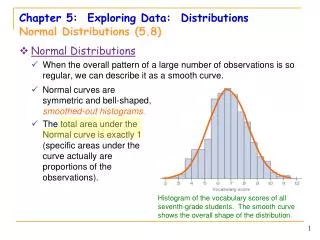
Displaying categorical data Frequency tables can be difficult to read. Sometimes it is easier to analyze a distribution by displaying it with a bar graph or pie chart.
Example 2: Portable MP3 music players, such as the Apple iPod, are popular—but not equally popular with people of all ages. Here are the percents of people in various age groups who own a portable MP3 player, according to an Arbitron survey of 1112 randomly selected people. a) Make a well-labeled bar graph to display the data. Describe what you see.
It appears that MP3 players are more popular among young people and that their popularity generally decreases as the age category increases.
b) Would it be appropriate to make a pie chart for these data? Why or why not? Making a pie chart to display these data is not appropriate because each percent in the table refers to a different age group, not to parts of a single whole. Graphs: Good and Bad Bar graphs compare several quantities by comparing the heights of bars that represent the quantities. Our eyes, however, react to the area of the bars as well as to their height. When all bars have the same width, the area (width × height) varies in proportion to the height, and our eyes receive the right impression. When you draw a bar graph, make the bars equally wide. Artistically speaking, bar graphs are a bit dull. It is tempting to replace the bars with pictures for greater eye appeal. Don’t do it!
Two-Way Tables and Marginal Distributions When a dataset involves two categorical variables, we begin by examining the counts or percents in various categories for one of the variables. Definition: Two-way Table:describes two categorical variables, organizing counts according to a row variable and a column variable.
Example 3: A survey of 4826 randomly selectedyoung adults (aged 19 – 25) asked, “What do you think are the chances you will have much more than a middle-class income at age 30?” The table below shows the responses, omitting a few people who refused to respond or who said they were already rich. a) What are the variables described by this two-way table? Gender and opinion about becoming rich. b) How many young adults were surveyed? 4,826
Two-Way Tables and Marginal Distributions Definition: TheMarginal Distribution of one of the categorical variables in a two-way table of counts is the distribution of values of that variable among all individuals described by the table. Note: Percents are often more informative than counts, especially when comparing groups of different sizes. To examine a marginal distribution: *Use the data in the table to calculate the marginal distribution (in percents) of the row or column totals. *Make a graph to display the marginal distribution.
Example 3 continued: Examine the marginal distribution of chance of getting rich.
Relationships Between Categorical Variables Marginal distributions tell us nothing about the relationship between two variables. Definition: A Conditional Distribution of a variable describes the values of that variable among individuals who have a specific value of another variable. • To examine or compare conditional distributions, • *Select the row(s) or column(s) of interest. • *Use the data in the table to calculate the conditional distribution (in percents) of the row(s) or column(s). • *Make a graph to display the conditional distribution. • -Use a side-by-side bar graph or segmented bar graph to compare distributions.
Example 4: a) Calculate the conditional distribution of opinion among males. b) Examine the relationship between gender and opinion.
Organizing a Statistical Problem As you learn more about statistics, you will be asked to solve more complex problems. Here is a four-step process you can follow. How to Organize a Statistical Problem: A Four-Step Process State: What’s the question that you’re trying to answer? Plan: How will you go about answering the question? What statistical techniques does this problem call for? Do: Make graphs and carry out needed calculations. Conclude: Give your practical conclusion in the setting of the real-world problem.