Download
1 / 27
270 likes | 413 Views
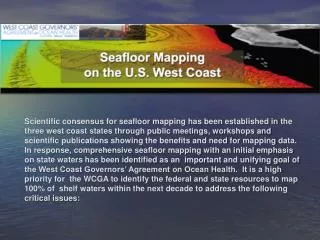
Scientific consensus on seafloor mapping has been established among West Coast states through public meetings and workshops. This initiative aims to map 100% of state waters within the next decade to address critical issues like tsunami modeling, alternative energy site identification, marine habitat science, coastal erosion, and navigation safety. High-resolution mapping data is essential for understanding coastal dynamics, protecting habitats, and ensuring safe maritime navigation. Collaborative efforts are underway to secure federal and state resources for this vital project.

E N D
Scientific consensus for seafloor mapping has been established in the three west coast states through public meetings, workshops and scientific publications showing the benefits and need for mapping data. In response, comprehensive seafloor mapping with an initial emphasis on state waters has been identified as an important and unifying goal of the West Coast Governors’ Agreement on Ocean Health. It is a high priority for the WCGA to identify the federal and state resources to map 100% of shelf waters within the next decade to address the following critical issues:
Tsunami Inundation Modeling Oregon, Northern California, Washington and Vancouver Island, face a 20-70% probability of experiencing a magnitude 8-9 subduction zone earthquake and tsunami in the next 50 years, much like the 2004 disaster in Indonesia. Given the impacts of the 2004 event, we are just now beginning to understand what a similar disaster will mean for the populations of the west coast. We are unable to accurately model tsunami inundation because the models depend on detailed coastal seafloor maps (and other factors) that presently do not exist. Data will also provide information on active nearshore faults and submarine landslides capable of generating smaller, locally important tsunamis.
Alternative Energy Sites and Dynamics The same storms, waves and tides that contribute to erosion along our coast can be used to generate renewable power through the application of emerging energy technologies. In fact, areas for future wave “farms” and tidal generators have already been proposed and demonstrations of power-generating buoys have been successful. Seafloor mapping is necessary for identifying, evaluating and siting potential wave power installations along the west coast.
Marine and Habitat Science We now understand that many west coast fish and other marine life are dependent upon spatially explicit, yet limited, seafloor habitat features. Describing and classifying these habitats are essential components of effectively assessing and managing west coast marine resources. Seafloor mapping is the fundamental starting point for modeling nearshore fish populations for both the Federal Essential Fish Habitat process and State fisheries management. Mapping is also needed to identify the marine debris that locally degrades important habitats.
Coastal Erosion and Rising Sea Level West coast states have been experiencing significant coastal erosion, threatening property, infrastructure, recreation, and coastal economies. Coastal erosion and significant flooding from large winter storms will become even more important as sea level continues to rise in the coming decades. Protecting the coastline and regional sediment management are among the many coastal zone management challenges that require high-resolution near-shore bathymetry and coastal topography. Seafloor mapping data provide the basis for modeling ocean circulation, currents, waves, and sediment transport, needed to develop mitigation strategies.
Navigation and Safe Commerce Nautical charting is of critical importance to safe navigation and commerce, and depends upon detailed seafloor data. Many areas along the west coast presently are charted based on data collected during the 19th and 20th centuries using lead weights at the end of a rope. Not only are these data of poor quality, the nearshore seabed is constantly changing, requiring modern new data. Modern surveys in these areas have revealed numerous unknown navigation hazards. High-resolution seafloor mapping data supports safe navigation and maritime commerce as well as providing base map data for engineering, scientific and commercial activities.
Seafloor Mapping in Oregon’s Territorial Sea* and Adjacent Waters *not to be confused with the US Territorial Sea
Background • Seafloor Mapping Task Force formed from interested state agency and academic parties in 2006. • Scientific Consensus Statement written in 2006 • Presentations made to State Officials and Agencies • Joint Committee on Emergency Preparedness • State Land Board • Ocean Policy Advisory Council (OPAC) • OPAC Marine Reserves Working Group and Science and Technology Advisory committee • Oregon Seafloor Mapping Workshop held at OSU 2008 • Similar meetings held in WA and CA • Oregon specific needs framed with regard to conservation, natural hazards & alternative energy development
Funding • 2007 HB 2924 – Academic model for implementation developed, Full amount proposed- not passed • 2009 • May 2009 - Oregon Legislature discusses using New Carissa settlement funds to support seafloor mapping. • Stakeholder Agencies meet at OSU to develop priority mapping areas • July 2009 - OR Legislature allocates $1.3 million for mapping over 2 years (2009-2010), Additional 1.3M for Marine reserves • NOAA OCS commits ~$5 million in additional support of Oregon’s “shovel ready” priorities. Workshop plan is implemented.
Project Structure • State, Federal, Industry collaboration emerges between OSU, Oregon, NOAA and David Evans & Associates (Survey Contractor to NOAA) • Initial estimate to pool resources and map ~30% of State Waters • Areas prioritized by stakeholders (ODFW, DSL, DLCD, OSU, DOGAMI) • Priority Areas focused on: • Marine Reserve Sites • Other Rocky Reef Areas • Wave Energy Sites • Tsunami vulnerable areas • Training Program developed at OSU • Students with an interest in mapping recruited through MRM program (4 students admitted) • Students staffed survey and sampling vessels and are processing data in the lab now • OSU has developed a new seafloor surveying course
Operational Plan • David Evans & Associates and OSU • Cape Perpetua North • OSU • Cape Arago South • Fugro Inc. • CA Crook Point
Vessels Mapping Sampling/Groundtruth R/V Pacific Storm, Newport, Oregon Owner: OSU Marine Mammal Institute Ships Complement: 12 (4-5 crew, 7-8 Science) Staffed by DEA Hydrographers and OSU team (2009) OSU 2010. F/V Michele Ann, F/V Miss Linda, F/V Delma Ann, F/V Maggie, R/V JAB Ships Complement: varies (2 Science) Staffed by OSU (DEA for the JAB)
Survey Areas 2009 – 2010 Results • Total Area = 3,250.45 nm2 = 100% • Previously Mapped = 177.2 nm2 = 5.45% • Mapped in 2009 = 896.8 nm2 = 27.59% • Mapped in 2010 = 578.7 nm2 = 16.5% Total now completed = ~ 49.5%
Sediment Sampling/Video Results • 738 Shipek grab samples taken • Photos & qualitative descriptions • 568 habitat specific samples • Photos & qualitative descriptions • Beckman Coulter PSA purchased • Grainsize analysis of all samples- Winter 2010-2011 • 47 towed video transects (34 hours bottom time • 30 video drops
Grain Size Analysis Laser Diffraction Particle Size Analyzer
Other State and Adjacent Areas in Federal Waters Ocean Observing Initiative Sites, Oregon And WashingtonSupported by the National Science Foundation
Other State and Adjacent Areas in Federal Waters Northern San Andreas Fault and Shelf AreaSupported by the NOAA Ocean Exploration Program, USGS and MMShttp://oceanexplorer.noaa.gov/
Other State and Adjacent Areas in Federal Waters Northern San Andreas Fault and Shelf AreaSupported by the NOAA Ocean Exploration Program, USGS and MMShttp://oceanexplorer.noaa.gov/
Other State and Adjacent Areas in Federal Waters Northern San Andreas Fault and Shelf AreaSupported by the NOAA Ocean Exploration Program, USGS and MMShttp://oceanexplorer.noaa.gov/ This was a “Green” cruise, using an auxilliary sailing vessel and an average of 1.6 gph for the multibeam/seismic survey
Other State and Adjacent Areas in Federal Waters Washington Sponge Reefs, Gray Canyon AreaSupported by the NOAA Northwest Fisheries Science Center and Coral Program
Other State and Adjacent Areas in Federal Waters OSU-MMS (nee BOEMRE) West Coast Alternative Energy Characterization StudySix sites in CA, OR and WA mapped and sampled for benthic infauna and geological characterization Mid-Shelf, Grays Harbor area
Data Integration and Next Steps April 2010 • Preliminary map products were delivered to community teams: • Bathymetric maps, sidescan sonar maps, preliminary habitat maps October 2010 • Other marine reserve related products should be completed, including species associations and larval dispersal model (supported by Packard Foundation) Spring 2011 • Continuing ground truth work, mostly southern Oregon • ROV /Towed camera work in conjunction with ODFW • 2011 appropriation