Download
1 / 34
340 likes | 471 Views
Coastal Regions and Land Loss. Chapter 10. Morris Island Lighthouse, SC. Coastlines. Active vs. passive margins Population concentration Seven of 20 largest US cities on or near coastline 53% US population lives in coastal counties. Deep-water wave form (water depth > 0.5L).

E N D
Coastal Regions and Land Loss Chapter 10
Coastlines Active vs. passive margins Population concentration • Seven of 20 largest US cities on or near coastline • 53% US population lives in coastal counties
Factors controlling waves Wind speed Duration Fetch
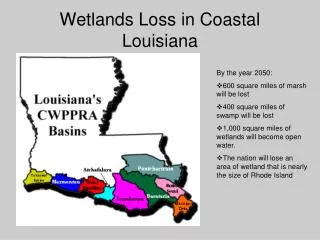
Sea level changes Eustatic sea level rise caused by • Changes in amount of water in oceans • Short-term • Changes in shapes and volumes of oceans • Very long term • Related to sea floor spreading Climate is major control • Thermal expansion or contraction of water
Shoreline conditions Emergent • Earthquakes and uplift/downdrop • Glacial rebound • Area: New England Submergent • Higher sea level • Irregular shorelines common • Area: Mid-Atlantic area – Chesapeake Bay (VA)
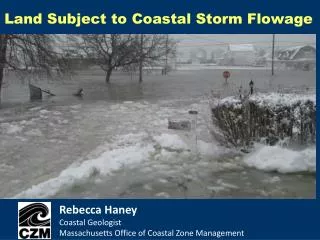
Very short-term changes Storm surges Changing tides • Extreme: Bay of Fundy, eastern Canada • 15 m tidal range twice daily • Normal daily changes (2 high, 2 low)
Note changes based on shoreline typelow coastlines most affected
Minimizing coastal hazards Hard stabilization Seawalls: concrete, large blocks Cause more problems than they solve; they enhance beach erosion
Groins: built perpendicular to shoreline Problem is the area down drift from groin is not fully replenished Fix by beach nourishment
Breakwaters Built to protect shoreline by intercepting waves Jetties Usually pairs of protrusions Note beach modifications
Soft (beach) Stabilization Moving sand around, usually from offshore Temporary solution due to dynamics Must be repeated
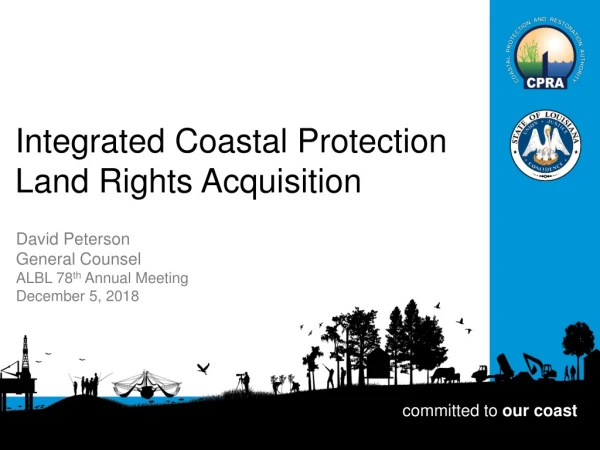
Managed “retreat” solution Prevent building Relocate threatened buildings
Miami Beach, FL24 million cubic yards over 10 years Before beach nourishment After beach nourishment
Cape Hatteras lighthouse Built 500 m from water Later moved 850 m inland