Download
1 / 27
280 likes | 512 Views
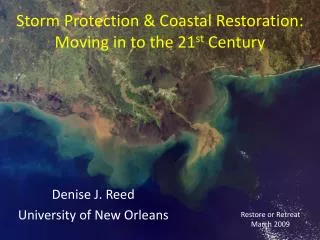
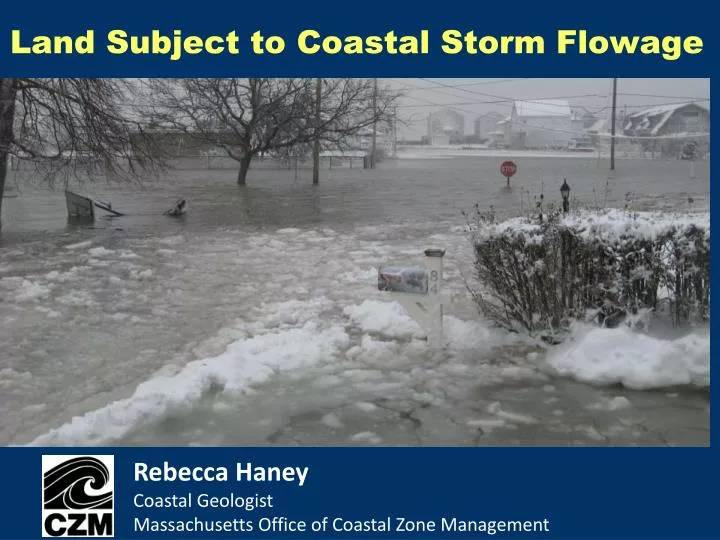
Land Subject to Coastal Storm Flowage. Rebecca Haney Coastal Geologist Massachusetts Office of Coastal Zone Management. Definitions/Terminology.

E N D
Land Subject to Coastal Storm Flowage Rebecca HaneyCoastal GeologistMassachusetts Office of Coastal Zone Management
Definitions/Terminology • Land subject to coastal storm flowage: means land subject to any inundation caused by coastal storms up to and including that caused by the 100-year storm, surge of record or storm of record, whichever is greater. (310 CMR 10.04) • 100 year storm = storm having a 1% chance of being equaled or exceeded in a given year.
FEMA FloodZone Definitions • Zone VE (V1-30) – Areas of 100-year coastal flood with velocity • Wave height 3 feet or greater • Wave runup depth 3 feet or greater • Within primary frontal dune (first dune landward of the beach) • Zone AE (A1-30) – Areas of 100-year flood; flood elevations • May be coastal or riverine • Coastal can contain up to 2.9 feet wave height • Coastal flood elevations at top of wave envelope • Zone AO – “Overwash” areas with flow depths of 1 to 3 feet • Generally coastal with sloping ground • Flow velocities can vary greatly • Flow paths are typically not well defined • Zone A – Areas of 100-year flood; NO flood elevations given • Shaded Zone X (B) – Areas of 500-year flood • Unshaded Zone X (C) – “Areas of minimal flooding”
Maps are graphic representations of engineering data Detailed information generated only at specific transects Effective maps may not have all current techniques incorporated FIRMs do not take into account future conditions (erosion, sea level rise) General Points to Consider
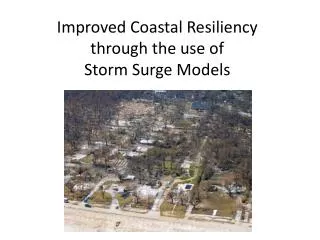
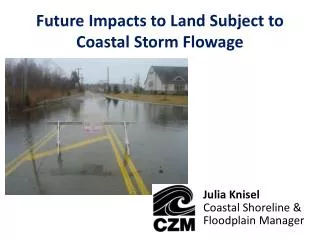
Impacts of Storms Extend Beyond Mapped Flood Zones on FIRMs • Storm of record can affect greater area than the mapped flood zones. • More than half the buildings in NY City affected by Sandy were outside the mapped flood zones. • 25% of all National Flood Insurance Claims are outside the mapped flood zones.
Storm Damage Nantucket Plymouth Salisbury Hull
Function: Sediment Supply Scituate Salisbury Plymouth Gosnold
Function: Ability to Erode, Shift, Move, Buffer Wave Action Rockport Scituate Friction Force Decreased
Function: Ability to Move, Shift, Migrate, Transport Sediment Scituate April, 2007 Source: Google
Functions: Erode, Shift, Move, Migrate Buffer Wave Action, 1951 1853 2008 Duxbury Source: Google Orthophoto: 2011
Impacts to Roads & Utilities Hull Westport Oak Bluffs Scituate
Inundation/Moving Water Boston Salisbury Marion Newbury
Summary • 25% of all NFIP claims occur outside the mapped flood zones. • Some types of land use are increasing damages to public infrastructure. • Storm damages are increasing in lower frequency events. • There are options to prevent this trend from continuing.