Download
1 / 16
160 likes | 197 Views
Explore turbidity levels and sediment transport in the Delaware Estuary, focusing on factors influencing light penetration and suspended matter concentrations. Delve into gravitational and tidal circulation, sediment sources and sinks, along with sediment delivery and transport dynamics in the estuarine system.

E N D
Understanding Turbidity in the Delaware Estuary Christopher K. Sommerfield College of Marine and Earth Studies University of Delaware 2007 Delaware Estuary Science Conference
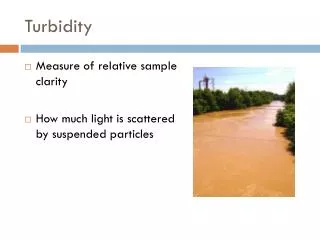
1 mg/l 10 mg/l 100 mg/l 1,000 mg/l 10,000 mg/l Coastal ocean Estuaries Rivers Turbidity: A measure of light penetration related to the concentration of suspended matter
Turbidity maximum Gravitational circulation Umax=10-20 cm/s Tidal circulation
Tidal circulation Umax=100 cm/s Tidal pumping = U x C net landward flux flux convergence net seaward flux
Sediment Sources and Sinks 1950-1985 Mass Balance SourceMass (tonnes/yr) Bottom erosion 3.4x10⁶ Rivers 1.3x10⁶ Phytoplankton 2.3x10⁵ Waste/industrial 1.7x10⁵ 5.1 0.9x10⁶ Sink Maint. dredging 2.8x10⁶ Marshes 2.1x10⁶ Subtidal shoals 6.3x10⁵ 5.5 1.1x10⁶ from Walsh (2004)
Annual sediment delivery Water discharge Sediment load Cook et al. (2006)
Along-estuary variability Bay mouth Pre-freshet Post-freshet Suspended mass = 20 - 40% of annual river influx Salinty (PSU) Cook et al. (2006)
Near-bed stress and resuspension Tinicum Island range, 15-m depth, sandy bottom ebb flood flood ebb Cook et al. (2006)
Near-bed stress and resuspension New Castle flats, 9-m depth, muddy bottom ebb flood flood ebb Cook et al. (2006)
Sediment-flux record: Spring 2003 Tinicum Isl. tidal landward seaward residual Tidal pumping transports suspended matter from the tidal river to the upper estuary. New Castle Cook et al. (2006)
2005 Sediment transport study New Castle C&D canal Bombay Hook
2005 Delaware River Flood Lambertville, NJ
New Castle 10 8 6 4 2 3-mo. mean Flood period landward seaward null point -20 -10 0 10 20 30 40 50 60 Artificial Island 10 8 6 4 2 Meters above bottom -20 -10 0 10 20 30 40 50 60 Bombay Hook 10 8 6 4 2 -20 -10 0 10 20 30 40 50 60 Velocity (cm/s) Residual current structure: Spring 2005
Research in progress • Quantify the relative importance of tidal • pumping and gravitational flow in • maintaining the ETM at its seaward end • Determine the size of suspended sediment • flocs in-situ and evaluate the influence of • settling velocity on the ETM locus