Download
1 / 20
200 likes | 232 Views
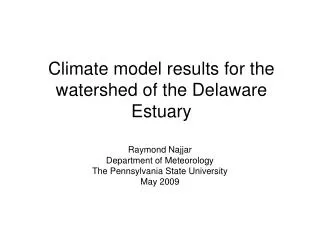
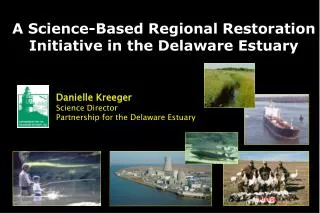
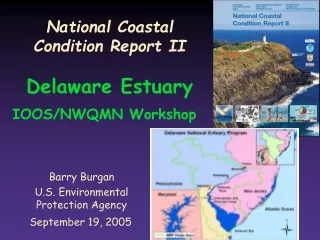
This report provides an overview of the ecological conditions of the Delaware Estuary and near-coastal waters in the United States. It includes information on indicators used, the national assessment, and the probability approach. The report serves as a benchmark for coastal programs and highlights partnerships between agencies and states.

E N D
National Coastal Condition ReportIIDelaware Estuary IOOS/NWQMN Workshop Barry Burgan U.S. Environmental Protection Agency September 19, 2005
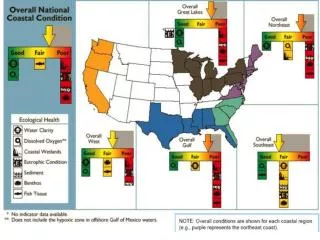
Overview • National Assessment • Probability Approach • Indicators used • National Coastal Condition • Delaware Estuary Condition
National Coastal Condition Report II • 1st truly national assessment of ecological conditions of 100% of the conterminous U.S. • Ecological condition for 1997-2000 determined from minimum of 50 sites/coastal state and Puerto Rico • Used common protocol to collect comparable data across programs and time
Purpose • Present a baseline picture of the condition of estuaries and near-coastal waters across the U.S. • Serve as a useful benchmark for analyzing the progress of coastal programs in the future • Future Reports will: • Focus on condition and health of the 28 National Estuary Programs • All coastal and near-shore resources including Alaska, Hawaii and territories • Trends of condition in all resources
Strengthened Inter-Agency and State partnerships as a result of the tech transfer, data-sharing and analysis the report represents NCCR II- Partners • EPA • NOAA • USGS • USFWS • Coastal States
Over 2,000 NCA sampling sites Nationwide With over 50,000 samples taken from 1997-2000
Probability Survey Designs • Probability design allows representation of all estuarine waters of a state, a region, and entire U.S. • Statistically robust approach that represents entire resource • Can be adapted to address multiple spatial scales simultaneously • Allows extrapolation from sampled sites to resource-wide assessments
Water Quality Index • WQI made up of five indicators: DIN, DIP, chlorophyll a, water clarity, and dissolved oxygen • Regional and sub-regional reference conditions (e.g., higher water clarity for significant SAV beds or active SAV restoration programs vs. high natural turbidity or extensive wetlands) • Site ranked poor if two or measures exceeded reference condition
Benthic Invertebrate Index • Poor benthic index score: low diversity, higher pollution-tolerant and fewer pollution-sensitive species • Benthic index based upon regional and sub-regional reference conditions • Poor benthos often co-occurs with degraded water quality and sediment quality
Sediment Quality Index • SQI made up of three indicators: exposure sediment toxicity, contaminant concentrations and total organic carbon (TOC) • Exposure toxicity evaluates survival of Ampelisca abdita in 10-day static test • Almost 100 contaminant compounds are compared to effects concentrations associated with adverse biological effects (ERM and ERL) • High TOC sediments harbor contaminants and can release them later at high temperatures • Site is rated poor if one or more of the 3 indicators are in poor category
Fish Tissue Contaminant Index • Whole-body burdens were determined for 16 compounds • Not always market species and market length • Compared to risk-based thresholds (4-8oz. meals/month) for cancer and non-cancer endpoints • Site ranked poor if score exceeds maximum value guidance criteria range
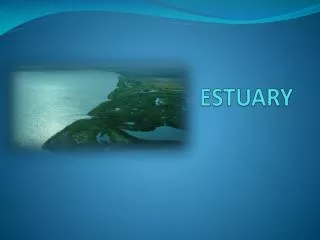
Delaware Estuary Sampling Station Location
Caveat • Water quality responses can’t be described by a single index for all estuarine systems. • An index that works well in a region may not describe eutrophic condition in a specific estuary. • In Delaware Bay, SS and DIN remained high during sampling when phytoplankton was light limited. • WQ degradation in much of the open water of the Bay is not considered a problem in late Summer. • Less weight could be given to nutrients and greater weight to Chlorophyll a or DO, in future.
National Coastal Condition Report II • National Coastal Condition Report II www.epa.gov/owow/oceans/nccr2 • National Coastal Assessment Data Base www.epa.gov/EMAP