Download
1 / 47
470 likes | 564 Views
Explore tools in engineering economics for analyzing capital investments, considering interest, time value of money, and economic decision-making strategies. Understand how to address economic issues efficiently.

E N D
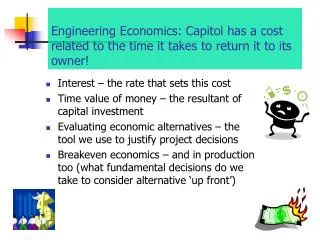
Engineering Economics: Capitol has a cost related to the time it takes to return it to its owner! • Interest – the rate that sets this cost • Time value of money – the resultant of capital investment • Evaluating economic alternatives – the tool we use to justify project decisions • Breakeven economics – and in production too (what fundamental decisions do we take to consider alternative ‘up front’)
When Addressing Economic Issues: • Ask the Client what their MARR is • Typically it is Prime rate + 5% • In these extraordinary times they may desire a better return! • Ask the Client how quickly they desire a payback • Often 1 year is desired • This short term thinking has lead to unsustainable businesses and off-shoring of manufacturing
When Addressing Economic Issues: • Ask the client if they want to consider Before Tax or After Tax cash flows • We live in a Capitalist Society – take advantage of the incentive for investment • For most organization the composite tax rate (Federal + State + Local) is up to 35% • This would consider book worth depreciation and salvage values • Find out what planning horizon is appropriate for the company • Typically 5 years but can be more or less
Interest: The capitalists fuel to lend! Interest = total amount owed – principal amount (12.1) (12.2) Interest = (principal)(number of interest periods)(interest rate) (12.3) = Pni
Nominal interest i = effective interest rate r = nominal interest rate m = interest periods per year y = number of years n = number of interest periods during compounding (12.9) (12.10)
F = ? A A A A A A A period 0 1 2 3 4 n-2 n-1 n Uniform series compound amount (12.11) (12.12)
F = ? P period 0 1 2 3 4 n-2 n-1 n Single payment compound amount (12.4) (12.5)
F P=? period 0 1 2 3 4 n-2 n-1 n Single payment present worth (12.6)
Uniform series compound amount P = ? A A A A A A A period n-2 n-1 n 0 1 2 3 4 (12.7)
P A=? A A A A A A period n-2 n-1 n 0 1 2 3 4 Capital recovery (12.8)
F A=? A A A A A A period 0 1 2 3 4 n-2 n-1 n Uniform series sinking fund (12.13)
A+(n-1)G A+(n-2)G A+(n-3)G P = ? A+4G A+3G A+2G A period n-2 n n-1 0 1 2 3 4 Gradient series (12.14) (12.15) (12.16)
Tools to Select from Alternatives – using Cash Flow Diagrams • Methods that Use a MARR: • PW • FW • EUAW • Return on Investment, Methods that calculate a “fictitious” interest rate to compare to MARR • IRR • ERR • Payback Methods • Simple Methods • Discounted Methods
Present worth method (12.17) (12.18)
Future worth method (12.19) (12.20) (12.21)
Equivalent annual worth method (12.22) (12.23)
Rate of return method (12.24)
Simple payback period (12.25)
Discounted payback period (12.26)
I Hate to say it BUT! • We still are driven by profitability • The ideas of Competitiveness and LEAN Mfg. need to be balanced against Quality results in Production • We find (in a Capitalist economy) that these competing(?) demands often can increase profitability if we let the factory move toward them • not first to volume production – the first to rational volume production is key!
An example from Engineering Economy – Machine Replacement analysis – After Tax Basis • Current Equipment “The Defender” (purchased a few years ago before Company started rational Quality Management system and JIT system) • Design Capacity: 310 molds/hr (620 parts/hr) • Part Tolerance: 0.030” across parting line • Average Quality: 2.9% defectives • Average Maintenance: $12000/yr
Machine Replacement analysis – After Tax Basis • When purchased, average “Lot Size” was 7500 molds and pattern change took 45 minutes • Currently, production lot size has fallen to 375 molds (and without significant investment) pattern change is still 45 minutes • Indicates 375/310 = 1.25 hr/pattern ‘run’ or 375 molds every 2 hours (with pattern change time) • Real Production rate is: 188 molds/hr (375 parts/hr)! (the horrors of JIT!)
Machine Replacement analysis – After Tax Basis • Quality/Maintenance “Downtime” consume 1 hour/shift • The plant operates two 10 hour shifts (20 planned hours) • but with downtime actual productive time is 18 productive hours/day on this machine • Good Castings/day = 375*.971*18 = 6555 (1,645,300/251day-year) • Scrap Castings/day = 375*.029*18 = 195 (48945/251day-year)
Quality Costs Are Like Icebergs! Sometimes Only 10% Are Visible The Rest Sink The Ship! • Visible Costs: • Scrap • Rework • Warranty Claims • Hidden Costs: • Eng/Mgt Time • Downtime • Increased Inventory • Decreased Capacity • Customer Dissatisfaction • Lose of Market Share
Machine Replacement analysis – After Tax Basis • Quality Cost Issues: • Eng/Mgt time: = 20400 • 8 hr/wk*51wks/yr@$50/hr • Inspect time: = 63750 • 50hr/wk *51wk/yr@$25/hr • Warranty Claims 85@$200 = 17000 • “Goodwill Costs” = 8000 • Total These Costs $109150
Machine Replacement analysis – After Tax Basis • “Product Issues” • Prod Costs (labor/mat’l/etc.) = 7.00 • Avg. Sale Price = 8.00 • NOTE: in most JIT (LEAN) systems cost must drop 5 to 10% annually to customer!!!! • Annual Income Defender (Rev – Costs) • Costs: • Pr. Cost (All Castings) + Qual. Costs + Maint. Costs7*(1645300 + 48945) + 109150 + 12000 = $11,980,865 • Revenue: • Price * # Good Parts = 8*1645300 = $13,162,400 • Income: 13,162,400 - $ 11,980,865 = $1,181,535
Machine Replacement analysis – After Tax Basis • Challenger Equipment • Design Capacity: 235 molds/hr (470 parts/hr) • Part Tolerance: +0.010” across parting line • Average Quality: 0.5% defectives • Average Maintenance: $8500/yr • This machine has ‘built-in’ quick change pattern technology so change is about 5 minutes (0.083 hours) • 750 parts takes (1.6 hrs + 0.083hr) = 1.68 hrs on this unit • This machine has an effect production rate of: 445 parts/hour
Machine Replacement analysis – After Tax Basis • Company does Preventative Maintenance so this machine works 20 hr/day • # Good Castings: 445*20*.995 = 8855*251=2,222,730/yr • # Scrap Castings: 445*20*.005 = 44*251 =11170/yr • Quality Costs: • Eng/Mgt time: NONE! • Insp. Time (spot Check) 5hr/wk*51 = $6375 • Warranty Costs 5/yr@$125 = $625 • Goodwill Costs NONE! • Total Q. Costs: =$7000
Machine Replacement analysis – After Tax Basis • Product Issues: • Production Costs: $7.10 • Avg Selling Price: $8.15(higher due to improved tolerances but will have to achieve continuing 5 – 10% reduction annually) • Annual Income Challenger (Rev – Costs) • Costs: • Pr. Cost (All Castings) + Qual. Costs + Maint. Costs7.1*(2222730 + 11170) + 7000 + 8000 = $15,875,690 • Revenue: • Price * #Good Parts = 8.15*2222730 = $18,115,250 • Income = $18,115,250 - $15,875,690 = $2,239,560
Machine Replacement analysis –Depreciation Issues • Defender (7yr MACRS asset now 3 yrs old) • Initial Cost: $1.5 Million • Present Mkt. Value: $650,000 • Pr. Book Value (1.25M – (.143 + .245 +.175)*1.25M) : $546,250 • Salvage Value (5 yrs): $220,000 • Challenger (7yr MACRS asset) • Initial Cost: $1 Million • Salvage Value (5 yrs): $425,000
Machine Replacement analysis – After Tax Basis – Depreciation Schedule
Machine Replacement analysis – After Tax Basis: 38% C. Tax rate, 12% MARR Potential Cap. Gain not taken by keeping Defender Long Term Cap. Gain -- Taken Saving in Income Tax Burden for not getting Cap. Gain of Selling Defender at > Bk Value
Machine Replacement analysis – After Tax Basis: 38% C. Tax rate, 12% MARR Long Term Cap. Gain Taken {since salvage value ($425K) exceeds Bk. Value ($223K)}
Defender “Followup” • You’re the Engineer – think about what to do? • Q 1: How much can this company spend to add ‘Quick-Change’ technology to existing machine? • Q2: Just by ‘Fixing’ Quality Issues, could the defender be kept? Show why or why not. • These are Typical Reasons that motivate Projects such as ours!
Make-Buy Decisions • A difficult problem addressed by the M-B matrix • Typically requires an analysis of the issues related to People, Processes, and Capacity • Ultimately the problem must be addressed economically
Make – Buy Decision Process Can Item be Purchased? NO YES Can Item be Made? NO YES
Make – Buy Decision Process Is it cheaper to make than buy? NO YES Is Capital Available To Make? NO YES
Break-even Curves for the Make or Buy Problem Cost to Buy = c1x Cost to make=K+c2x K Break-even quantity
Example M-B Analysis • Fixed Costs to Purchase consist of: • Vendor Service Costs: • Purchasing Agents Time • Quality/QA Testing Equipment • Overhead/Inventory Set Asides • Fixed Costs to Make (Manufacture) • Machine Overhead • Invested $’s • Machine Depreciation • Maintenance Costs • Order Related Costs (for materials purchase and storage issues)
Example M-B Analysis • BUY Variable Costs: • Simply the purchase price • Make Variable Costs • Labor/Machine time • Material Consumed • Tooling Costs (consumed)
Example M-B Analysis • Make or Buy a Machined Component • Purchase: • Fixed Costs for Component: $4000 annually ($20000 over 5 years) • Purchase Price: $38.00 each • Make Using MFG Process A • Fixed Costs: $145,750 machine system • Variable cost of labor/overhead is 4 minutes @ $36.50/hr: $2.43 • Material Costs: $5.05/piece • Total Variable costs: $7.48/each
Example M-B Analysis • Make on MFG. Process B: • Fixed Cost of Machine System: $312,500 • Variable Labor/overhead cost is 36sec @ 45.00/hr: $0.45 • Material Costs: $5.05 • Formula for Breakeven: Fa + VaX = Fb + VbX X is Break even quantityFi is Fixed cost of Option iVi is Variable cost of Option i
Example M-B Analysis • Buy vs MFG1: BE is {(145750-20000)/(38-7.48)} = 4120 units • Buy vs MFG2: BE is {(312500-20000)/(38-5.5)} = 9000 units • MFG1 vs MFG2: BE is {(312500-145750)/(7.48-5.50)} = 68620 units
R Cost Profit TC breakeven point Loss FC q q* Breakeven quantity Breakeven analysis
Summary • Engineering economic analyses should consider the time value of money • Interest factor formulas and tables are useful in evaluating alternatives – remembering that interest it the cost of capitol and the fuel that makes capitol available! • The PW and FW methods (often used because they can easily accommodate Before and After Tax valuations) can be used to evaluate alternatives having different lives by using the least common multiple of years.
Summary, Cont. • The EUAW method is preferred because it has the advantage of not requiring the use of the least common multiple. • Companies typically use short payback period methods since future returns are very difficult to reliably model • The breakeven point is that level of production (and sales) that results in a zero profit which helps companies in making difficult make vs. buy decisions