Correlation vs. Causation: Statistics & Graphing Handout
270 likes | 288 Views
This handout aims to help students grasp the distinction between correlation and causation, recognize positive/negative correlations, and interpret twin study data. It explores correlation coefficients, central tendency measures, and examples illustrating the concepts. The material covers the importance of not mistaking correlation for causation, the significance of graphing correlations, and the potential pitfalls of forgetting this distinction in research. It also delves into illusionary correlations, patient case histories, surveys, and the limitations of correlation research.

Correlation vs. Causation: Statistics & Graphing Handout
E N D
Presentation Transcript
Correlation & Statistics“Correlation does not mean Causation”
Target Goal Students will be able to understand the difference between correlation and causation. Students will be able to recognize positive & negative correlations
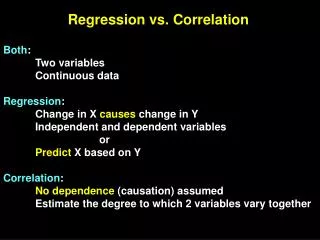
Correlation-Handout (Twin studies) • Correlation Coefficient • A statistical measure that indicates how well either factor predicts the other Indicates direction of relationship (positive or negative) Correlation coefficient r = +.37 Indicates strength of relationship (0.00 to 1.00)
Minnesota Twins Study: • Apart Together • Personality .5o .88 • Religion .49 .51 • IQ .69 .88 • IQ & Grades +.65 • HS GPA & College GPA +. 70 • Drug Use & GPA -.68
CORRELATION VS CAUSATION • https://study.com/academy/lesson/correlation-vs-causation-differences-lesson-quiz.html
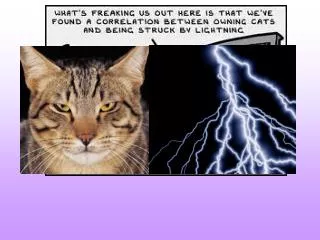
Understanding Correlations • NOT Cause and effect • Frosted Flakes prevents cancer, oatmeal causes cancer ( Good News Survey) • TV watching is linked to childhood obesity
Statistics- GRAPHING CORRELATIONS • How do we describe data? -Gather raw data -Frequency Distribution= number or frequency of a behavior. - X-axis=data you are graphing • Y-axis= represents frequency
Measures of Central tendency • Mode- The score that occurs most often • Why Use? • Median-the middle score • How do we calculate median?
Calculating Mean…. • Mean-The average of all scores How do we calculate mean? How can mean be distorted? Outliers= example
Examples: ( Hand signs) • 1. Professor Johansen finds that for every diet beverage someone drinks during the day, the likelihood of heart attacks increases by 4 percent • Margaret notices that the temperature in her office drops several degrees from July to December. In a careful review of the budget she discovers that the company’s utility expenses also drop from July to December
Ex-Cont • Many students in Professor Handel’s class express that they want a review session. Professor Handel agrees to hold an open review session for two hours the day before the exam. He then has his TA write down when each student arrives at the session and when they depart. When the exams are graded, Professor Handel announces there will be no more review sessions. The longer students spent at the review session the lower their score on the exam.
Ex- Cont • Ariel enjoys collecting Black and Decker tools. Her garage is filled with every gadget ever made by Black and Decker. Her neighbors knowing this frequently borrow tools from her. Ariel notes that her neighbors are better about returning the tools when they live on her side of the street than when they live across the street.
Illusory Correlation Defined: Belief in a relationship between variables when no relationship exists --Adoption & Conception
Research: • Case History= A biographical review of patients relevant history. • Advantages: - In depth info - Rare Phenomena or unusual cases - Preexisting cases don’t involve ethics Disadvantages: - Can’t generalize results - Inaccurate reporting - no cause and effect
Survey • The self-reported attitudes or behaviors of people • Ending Suffrage You tube • Advantages: -Time & $ - Gather Large amount of data Disadvantages: - Self report, difficult to construct
Correlation Research • Advantages: Saves $ and time Can allow one to make predictions Allows use of preexisting data Disadvantages: Cant establish CAUSE & EFFECT Prone to inaccurate reporting ( survey) Confounding variables Cant manipulate variables