Download
1 / 16
160 likes | 372 Views
Macro Forecast of US Rail & Trucking Industries – 2004 vs 2016. 2006 TCI Conference Cherry Hill, NJ - September 2006 Presented by: Gordon Heisler, Senior Consultant Professional Logistics Group, Inc. About PLG.

E N D
Macro Forecast of US Rail & Trucking Industries – 2004 vs 2016 2006 TCI Conference Cherry Hill, NJ - September 2006 Presented by: Gordon Heisler, Senior Consultant Professional Logistics Group, Inc.
About PLG • Provides logistics consulting, management, engineering, market analysis, and facility development services • Focused on chemicals, plastics, energy products, and other bulk commodities • Formed in 2001 • Headquarters in Chicago, with team members in Dallas, Houston, Baltimore, Philadelphia, Milwaukee, and New Jersey • PLG team is comprised of more than a dozen logistics veterans, all with at least 20 years of experience within major shipper, transportation, engineering, or related services companies
Westlake Partial Client List Some of our 25+ clients include:
Primary Services for Shippers - Logistics planning & strategy - Logistics procurement - Distribution network optimization - Major contract and RFP negotiations - Outsource management of strategic logistics functions - Rail design & engineering - Facilities development
US Freight Movements: Legislative and Political Environment • Domestic Federal Surface Transport Program SAFETEA LU Bill (2005-2009) 5% real $$ funding increase vs. prior TEA-21 • Real improvement needs & maintenance vs. Funds available $1Trillion shortfall over next 10 years • Increased port funding likely at expense of inland waterways • Increased rail competition unlikely unless catastrophic event forces change
Modal Capacity Challenges - 2006 • Far East import explosion • Global economy on many raw materials increases imports • Port & Customs capacity strained • Labor shortages – operator level, all modes • Security = increased costs and delays • Rail service deterioration • Highway & Rail congestion = productivity loss • Pending 2007 EPA air and fuel rules change
Freight Future by 2020 • Imports and exports double every 10 years • Freight traffic within US borders increases 100% from 2004 • Foreign trade through US ports has increased by 180% vs. 2004 • Containerized cargo increases by 350% • Domestic trucks move 75% more tons • Railroads move 44% more tons Source – J.T. Mentzer, Univ. of Tennessee
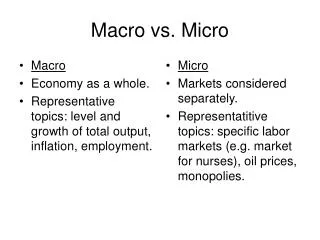
Domestic Transport Market by Mode - 2004 Mode Volume Share % Revenue Share % Truck 68% 88% Rail 15.5% 5.5% Water 7.4% 1.1% Air & Pipe balance balance Total 14,500 million tons $766 Billion Source – Global Insight
Current North American Railroad Industry Environment • Unprecedented Growth, especially intermodal Freight Cost increases to shippers Fuel Surcharge recovery in excess of fuel expense • New pricing policy – now market based instead of cost based • 2 of big 4 Carriers earned cost of capital in 2005 • Congestion will worsen as volumes grow • Service can improve but major progress is unlikely
North American Railroads Growth Forecast Average annual growth rate (%) 2006-2016 Volumes 2.1% Cost/Price Escalation 5.2% Sources – MSDW, UBS, Global Insight
North American Railroads: Will Industry Capacity Expand to Handle Growth? • Expect congestion and strained infrastructure • Expansion will be reactive to growth • Selective capacity expansion will occur • Capacity restrictions will push prices higher • Issues Fuel surcharges will add to carrier profits Price increases will moderate following rollover of legacy contracts A terrorism or Hazmat catastrophe will impact hazmats dramatically
North American Trucking Packaged Freight Carriers • Industry and market dynamics 52% of total truck market volume Top 50 carriers handle 18% of volume Gaining market share vs. other modes • Concerns Truck driver availability is critical Average driver age is 45 yrs Need 110m drivers by 2014 w/o attrition Projected 2014 need is 500,000 drivers Wage increase of 60% is needed to attract/retain vs. peer industries ($40k/yr now to $60+k/yr)
North American Trucking Volume Growth Average annual growth rate (%) 2006-2016 Bulk Trucking 2.2% Package Trucking 3.1% Sources – ATA, NTTC, Global Insight
North American Trucking Cost & Price Escalation Average annual growth rate (%) 2006-2016 Bulk Trucking 4.7% Package Trucking 5.3% sources – MSDW, UBS, Global Insight, Carrier interviews
North American Trucking: Will Industry Capacity Expand to Handle Growth? • Bulk Industry should be able to expand, less certain than package Issues Under funded small operators Shrinking Hazmat driver pool • Package Industry can and will expand Issues Driver availability and pay Highway congestion
Thank you! For questions or more information please contact Gordon Heisler at 215-620-4247 or gheisler@prologisticsgroup.com Professional Logistics Group, Inc. www.prologisticsgroup.com