Download

1 / 21
210 likes | 397 Views
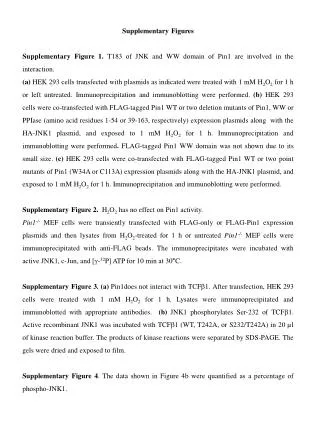
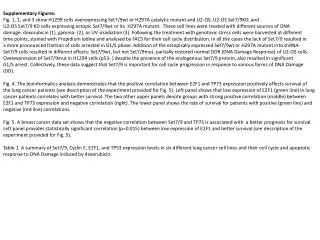
Supplementary tables and figures. Supplementary table 1. P-values calculated within each data set, using Students T-test, between poor and good outcome groups. P-values below 0.05 are highlighted with green. Supplemntary figures. Refining of differently expressed regions on chromosome regions:

E N D
Supplementary table 1 P-values calculated within each data set, using Students T-test, between poor and good outcome groups. P-values below 0.05 are highlighted with green
Supplemntary figures Refining of differently expressed regions on chromosome regions: 1p (supplementary figure 1) 1q (supplementary figure 2) 12q (supplementary figure 3) 14q (supplementary figure 4) 16q (supplementary figure 5) 17q (supplementary figure 6) 20q (supplementary figure 7) A: Sliding mean plot. The cytogenetic bands corresponding to gene sets in the GSEA analysis are indicated in the blue bar and core regions are highlighted as a black bars. B-D: Scaled ratios of differently expression (RDE) for all genes in the core regions.
Suppelementary figure 1A 1p36 1p35 1p34 1p33-32 1p31 1p22 1p21 1p13-12 Sliding mean of RDE DIRAS3 Gene number
Suppelementary figure 1B Sliding mean of RDE DIRAS3 TGFBR3 GNG12 GADD45A Gene number
Supplementary figure 2A 1q11-22 1q23 1q24 1q25 1q31 1q32 q41 1q42 q43 q44 Sliding mean of RDE Gene number
Supplementary figure 2B ACTA1 ARF1 Sliding mean of RDE NVL Gene number
Supplementary figure 3A Sliding mean of RDE 12q11-12 12q13 12q14 q15 12q21 12q22-23 12q24 Gene number
Supplementary figure 3B MYF6 Y=2.58 MDM2 Sliding mean of RDE Gene number
Supplementary figure 4A Sliding mean of RDE FOS, TGFB3 14q11 14q12 14q13 14q21-22 14q23 14q24 14q31 14q32 Gene number
Supplementary figure 4B Sliding mean of RDE ALDH6A1 TGFB3 KIAA1737 FOS ZADH1 C14orf44 Gene number
Supplementary figure 5A Amsterdam 16q HUMAC Huang S2003 Stockholm 1.1 Uppsala GINS2 S2006 PRMT7 Rotterdam 1.08 1.06 Sliding mean of RDE 1.04 1.02 1 0.98 16q11-12 16q13 q21 16q22 16q23 16q24 0.96 0 100 200 300 400 500 600 Gene number
Supplementary figure 5B PRMT7 CDH3 Sliding mean of RDE CDH1 Gene number
Supplementary figure 5C GINS2 SL7A5 MVD CDT1 FANCA Sliding mean of RDE Gene number
Supplementary figure 6A Survivin, TK1 Sliding mean of RDE 17q11 17q12 17q21 17q22 17q23 17q24 17q25 Gene number
Supplementary figure 6B HER2 Sliding mean of RDE Gene number
Supplementary figure 6C Amsterdam 17q21-23 HUMAC EPN3 Huang ABCC3 S2003 DGKE Stockholm 1.8 Uppsala S2006 Rotterdam 1.6 1.4 Sliding mean of RDE 1.2 1 0.8 0.6 0.4 0 20 40 60 80 100 120 140 160 Gene number
Supplementary figure 6D LLGL2 RECQL5 GALK1 TK1 survivin Sliding mean of RDE Gene number
Supplementary figure 7A E2F1 NCOA3 AURKA ZNF217 Sliding mean of RDE 20q11 20q12 20q13 Gene number
Supplementary figure 7B E2F1 EIF2S2 MAPRE1 NCOA6 Sliding mean of RDE Gene number
Supplementary figure 7C SLC2A10 NCOA3 KCNG1 CSE1L ZNF217 AURKA Sliding mean of RDE Gene number