Download
1 / 16
160 likes | 320 Views
Ligand-binding site prediction based on 3D protein modeling. 제 3 회 단백질연구발표회 Aug. 24. 2009. Mina Oh, Keehyoung Joo and Jooyoung Lee Korea Institute for Advanced Study. Ligand-binding site prediction. The detection of ligand-binding sites is the starting point

E N D
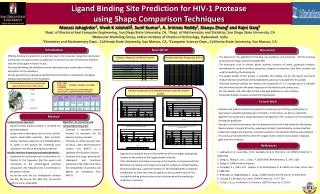
Ligand-binding site prediction based on 3D protein modeling 제3회 단백질연구발표회 Aug. 24. 2009 Mina Oh, Keehyoung Joo and Jooyoung Lee Korea Institute for Advanced Study
Ligand-binding site prediction The detection of ligand-binding sites is the starting point for protein function identification and drug discovery • Sequence-Structure-Function paradigm • Binding Site Prediction • Binding-Ligand candidates • To understand protein structure and function relationship T0457 (PDB code:3dev) MG Binding
Motivation of Method • How can we use 3D protein models to predict protein binding sites? • There are many known structures bound ligands in the PDB • In CASP7: we achieved top results in high accuracy structure prediction category Predicted protein model Superimposed model : Ligand-bound Templates are superimposed Putative binding sites & Binding residues identification Brylinski M. etal. PNAS 105, p129 (2008)
Method details Part I Template-based modeling Query sequence (a) Calculating all of distances between the centers of masses of ligands by a distance cutoff (1-4.5Å) (b) Identification of binding residues from the putative binding site by the distance cutoff - ranking: as cluster size, i.e. the number of ligands in a cluster (c) The contact residues are determined by detecting all atoms within distance cutoffs (3.0- 4.5Å) PDB Fold recognition Templates Protein modeling based on global optimization protein 3D models Structure superposition between model and templates Templates with ligands(a) Superimposed model Clustering of ligands Determination of binding residues(c) Putative binding sites(b) Part II 3D model based binding-site residue prediction
Benchmark & Test set • Benchmark: the set of CASP7 function prediction targets • 22 proteins • Test set: CASP8 (2008) • 27 proteins • In a blind fashion • Two measures for assessing binding residue predictions N: # of correctly predicted binding res. P: # of predicted binding res. T: # of annotated binding res. Accuracy (%) = N/P ⅹ100 Coverage (%) = N/T ⅹ100
CASP7 Benchmark (22 targets) • HA-TBM: easy (6 targets) • TBM: medium (14 targets) • FM: hard (1 target) • TBM/FM (1 target) A total of 28 biologically relevant bound ligands 22 different targets PDB-code DNP: did not predicted
CASP8 Prediction (27 targets) DNP: did not predicted; NNS: No Native Structure is available
T0391 (TBM) Magenta X-ray (3d89A) Blue LEE model Ligand: FES complex PDB code: 3d89 HETERO ATOMS: FES FES 57 59 60 61 62 80 82 83 85 Prediction: FESBinding Accuracy = 9/10 = 90 % Coverage = 9/9 = 100 % GDT-HA: 50.73
T0425 (TBM) LEE model PDB code: 3czx HETERO ATOMS: ZN ZN 11, 25, 77 (H, E, H) Prediction: ZNBinding Accuracy = 3/3 = 100 % Coverage = 3/3 = 100 % GDT-HA : 50.14
What factor is significant? An example (T0369) from metal (NI)-bound target LEE Zhang A = 3/3 = 100 % C = 3/3 = 100 % A = 1/2 = 50 % C= 1/3 = 33 %
Model quality vs Acc+Cov • Data set above 1σ GDT-TS among 100~120 submitted models • Model quality measures: • Backbone : GDT-TS, GDT-HA, GDT-TL • Side-chain (global & local) : H-bond, χ1 , χ1+2 accuracy • local rmsd • Investigation according to metal / non-metal targets • Pearson’s correlation coefficient (r) btw model quality measures and Acc+Cov ,
Metal-bound Targets Correlation coefficient (r) btw each model quality measure and Acc+Cov ,
Non-metal-bound Targets Correlation coefficient (r) btw each model quality measure and Acc+Cov
Conclusions • We developed a new method to predict protein binding sites / ligands using 3D protein models (Acc=70, Cov=80 for LEE) • Highly accurate 3D models increase the accuracy as well as the coverage of binding site prediction • Metal-bond protein: local side-chain accuracy is important factor. • Non-metal-bond protein: backbone accuracy is important factor • Future work • Method development: finding the clustering & contact cutoffs depending on metal/ non-metal ligands • Challenging: applying to mutation study & drug discovery