Example
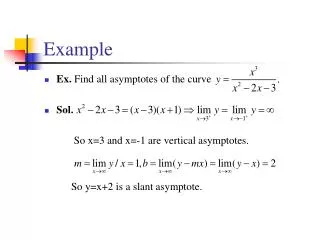
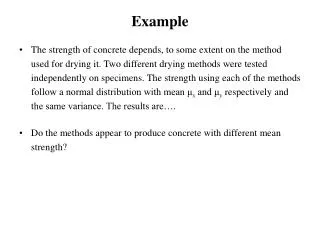
Example. The strength of concrete depends, to some extent on the method used for drying it. Two different drying methods were tested independently on specimens. The strength using each of the methods follow a normal distribution with mean μ x and μ y respectively and

Example
E N D
Presentation Transcript
Example • The strength of concrete depends, to some extent on the method used for drying it. Two different drying methods were tested independently on specimens. The strength using each of the methods follow a normal distribution with mean μx and μy respectively and the same variance. The results are…. • Do the methods appear to produce concrete with different mean strength?
Likelihood Ratio Tests - Introduction • Neyman-Pearson lemma provides a method of constructing most powerful tests for simple hypothesis when the distribution of the observations is known except for the value of a single unknown parameter. Sometimes it can be utilized to find uniformly most powerful test for composite hypothesis that involve a single parameter. • In many cases, the distribution of interest has more than one unknown parameter. • Likelihood ratio test is a general method used to derive tests of hypothesis for simple or composite hypotheses.
Likelihood Ratio Test • The null hypothesis specifies that the parameter (possibly a vector) lies in a particular set of possible values denoted by Ω0 and the alternative hypothesis specifies another set of possible values denoted by Ωa, which does not overlap with Ω0. • Examples… • A likelihood ratio test has a test statistic Λ defined by • For a fixed size α test the decision rule is: reject H0 if Λ ≤k where k is determined such that P(Λ ≤k | H0) = α.
Translation of the Likelihood Ratio Test • Small value of Λ indicates that the likelihood of the sample is smaller under H0 and therefore the data suggest that H0 is false. • Large value of Λ indicates no evidence against H0.
Distribution of the Likelihood Ratio Statistic • In many cased the distribution of the test statistic Λ is known and can be used to find k and the rejection region. • If the distribution of Λ is unknown we use the fact that where r is the number of parameters specified in H0. This result is true for large n. • The critical region in this case is: reject H0 if