Download
1 / 43
430 likes | 578 Views
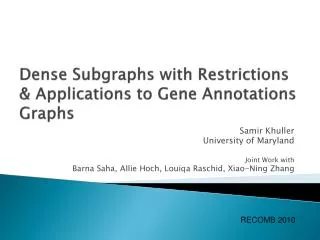
Dense Subgraphs with Restrictions & Applications to Gene Annotations Graphs. Samir Khuller University of Maryland Joint Work with Barna Saha, Allie Hoch, Louiqa Raschid, Xiao-Ning Zhang. RECOMB 2010. Story of the collaboration. Louiqa Raschid (BMGT) Life Sciences Data Mgt.

E N D
Dense Subgraphs with Restrictions & Applications to Gene Annotations Graphs Samir Khuller University of Maryland Joint Work with Barna Saha, Allie Hoch, Louiqa Raschid, Xiao-Ning Zhang RECOMB 2010
Story of the collaboration Louiqa Raschid (BMGT) Life Sciences Data Mgt. Barna Saha (CS) Ph.D. student Samir Khuller (CS) Algorithms TIME Allie Hoch (CS) Undergrad Xiao-Ning Zhang (Bio) User evaluation
TAIR Annotation Example gene annotations
GO-(gene)-PO tri-partite graph PO:0020030 cotyledon PO:0009009 embryo GO:0009686 gibberellin biosynthetic process PO:0019018 embryo axis PO:0009067 filament PO:0009046 flower GO:0009639 response to red or far red light PO:0009001 fruit PO:0009025 leaf GO:0010114 response to red light PO:0020001 ovary placenta PO:0009064 receptacle GO:0009739 response to gibberellin stimulus PO:0009005 root PO:0003011 root vascular system AT1G15550GA4 GO:0009740 gibberellic acid mediated signalling PO:0000014 rosette leaf PO:0004723 sepal vascular system GO:0016707 gibberellin 3-beta-dioxygenase activity PO:0020148 shoot apical meristem PO:0009047 stem GO:0008134 transcription factor binding PO:0020141 stem node PO:0004714 terminal floral bud GO:0005737 cytoplasm PO:0007057 0 germination PO:0007131 seedling growth
GO Ontology GO:0008135 biological process GO:0009639 response to red or far red light GO:0009739 response to gibberellin stimulus GO:0009686 gibberellin biosynthetic process GO:0010114 response to red light GO:0009740 gibberellic acid mediated signalling
PO Ontology Plant structure PO:0009005 root PO:0009001 fruit PO:0009025 leaf PO:0009009 embryo PO:0004714 terminal floral bud PO:0020030 cotyledon PO:0000014 rosette leaf PO:0019018 embryo axis PO:0009047 stem PO:0009046 flower PO:0020141 stem node PO:0009064 receptacle PO:0003011 root vascular system PO:0009067 filament PO:0004723 sepal vascular system PO:0020148 shoot apical meristem PO:0020001 ovary placenta
Gene Annotation Graph • Construct graphs for each gene using their GO, PO annotations • Combine the graphs of several genes into one single weighted graph GO 1 PO 1 Gene 1 GO 2 PO 2 Gene 2 GO 3 PO 3 Gene 3 GO 4 PO 4 Gene 4
The Problem GO 1 PO 1 Gene 1 Node GO 2 PO 2 Gene 2 GO 3 PO 3 Gene 3 GO 4 PO 4 Gene 4 Biologists would like to find patterns in gene annotation graphs – but these are huge! Need to allow biologists some control over the kind of patterns that are computed Would like to find biologically meaningful patterns Edge
GO-(gene)-PO tri-partite graph PO:0020030 cotyledon PO:0009009 embryo GO:0009686 gibberellin biosynthetic process PO:0019018 embryo axis PO:0009067 filament PO:0009046 flower GO:0009639 response to red or far red light PO:0009001 fruit PO:0009025 leaf GO:0010114 response to red light PO:0020001 ovary placenta PO:0009064 receptacle GO:0009739 response to gibberellin stimulus PO:0009005 root PO:0003011 root vascular system AT1G15550GA4 GO:0009740 gibberellic acid mediated signalling PO:0000014 rosette leaf PO:0004723 sepal vascular system GO:0016707 gibberellin 3-beta-dioxygenase activity PO:0020148 shoot apical meristem PO:0009047 stem GO:0008134 transcription factor binding PO:0020141 stem node PO:0004714 terminal floral bud GO:0005737 cytoplasm PO:0007057 0 germination PO:0007131 seedling growth
GO-PO bipartite graph PO:0020030 cotyledon PO:0009009 embryo GO:0009686 gibberellin biosynthetic process PO:0019018 embryo axis PO:0009067 filament PO:0009046 flower GO:0009639 response to red or far red light PO:0009001 fruit PO:0009025 leaf GO:0010114 response to red light PO:0020001 ovary placenta PO:0009064 receptacle GO:0009739 response to gibberellin stimulus PO:0009005 root PO:0003011 root vascular system GO:0009740 gibberellic acid mediated signalling PO:0000014 rosette leaf PO:0004723 sepal vascular system GO:0016707 gibberellin 3-beta-dioxygenase activity PO:0020148 shoot apical meristem PO:0009047 stem GO:0008134 transcription factor binding PO:0020141 stem node PO:0004714 terminal floral bud GO:0005737 cytoplasm PO:0007057 0 germination PO:0007131 seedling growth
Gene Annotation Graph • Construct complete bipartite graph for each gene using their GO, PO annotations • Combine the bipartite graphs of several genes into one single weighted graph 1 GO 1 PO 1 2 1 3 2 GO 2 PO 2 1 1 3 1 GO 3 PO 3 2 1 3 GO 4 PO 4 1
How can we extract knowledge? • Cliques – these might give us some biological information – but this is a stringent reqmt. • However clique finding is well known to be really hard (NP-hard, hard to approximate). • Why not look for “dense regions”? • Note that the notion of density could be defined for hyper-edges as well, but for our purposes this does not do as well.
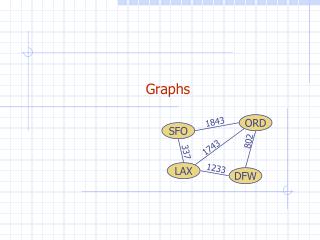
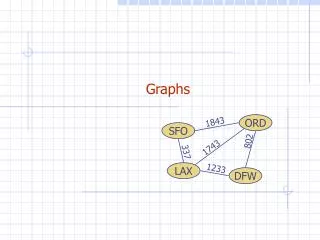
Density sum of weights of edges in the induced subgraph Graph density = number of nodes in the induced subgraph The density of {1,2,3,4,5,6,7} = 9/7 = 1.28 The density of {1,2,3,4} = 6/4 = 1.5 The densest subgraph is {1,2,3,4}. 1 1 2 How do we compute the densest subgraph? Surprisingly, this can be solved optimally in polynomial time! [Goldberg 84, Lawler 76, Queyranne 75] Easily extends to weighted graphs. 3 4 5 6 7
Dense Subgraphs in Gene Annotation Graph • A collection of GO-PO terms that appear together in the underlying genes. 1 GO 1 PO 1 2 1 3 2 GO 2 PO 2 1 1 3 1 GO 3 PO 3 2 1 3 GO 4 PO 4 1 (GO3,PO1),(GO3,PO2),(GO3,PO4),(GO4,PO1),(GO4,PO2),(GO4,PO4) appear frequently in the 4 genes
Biologically Meaningful Dense Subgraphs • Are all dense subgraphs biologically meaningful ? • How do we allow biologists to have some control over the kind of dense subgraphs that are computed ? • Putting size constraints makes the problem intractable immediately. • Densest subgraph of size >=k. NP-hard, but can get 2 approximation [Khuller, Saha] • Densest subgraph of size <=k. NP-hard and no good approximations known
Biologically Meaningful Dense Subgraphs • Are all dense subgraphs biologically meaningful ? • How do we allow biologists to have some control over the kind of dense subgraphs that are computed. • In fact we can impose both restrictions at the same time! Distance Restricted Restrictions in dense subgraph computation GO terms and similarly PO terms that appear must be biologically related Subset Restricted Certain GO, PO terms must appear in the returned subgraph
Biologically Meaningful Dense Subgraphs • Are all dense subgraphs biologically meaningful ? • How do we allow biologists to have some control over the kind of dense subgraphs that are computed ? Distance Restricted Restrictions in dense subgraph computation Subset Restricted GO terms that appear in the densest subgraph must be close in the GO ontology graph and similarly for the PO terms
Distance Restricted Subgraph Problem • Distance threshold = 1 • This means that some sets of nodes are not allowed to coexist in the final solution: {GO1 ,GO2}, {GO1,GO4}, {PO1 ,PO4}, {PO1,PO2},{PO2,PO3,}. • The final solution is {GO2, GO3, GO4, PO2, PO4}, which has a density of .8. PO1 PO1 GO1 GO1 PO2 PO2 GO4 GO2 GO2 PO3 PO3 GO3 GO3 GO4 PO4 PO4
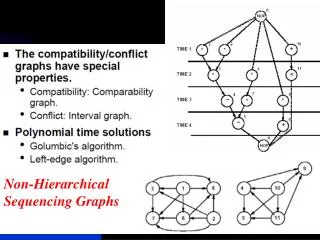
Distance Restricted Subgraph Problem • For arbitrary ontology graph structure • NP Hard even to approximate it reasonably • Reduction from Independent set problem • Factor 2 relaxation of distance threshold is enough to get a solution with density as high as the optimum • Trees, Interval Graphs, Each edge participates in small number of cycles • Polynomial time algorithm to compute the optimum
Subset Restricted Dense Subgraph • Are all dense subgraphs biologically meaningful ? • How do we allow biologists to have some control over the kind of dense subgraphs that are computed ? Distance Restricted Restrictions in dense subgraph computation Subset Restricted Given a subset of GO, PO terms compute the densest subgraph containing them.
Subset Restricted Dense Subgraph 1 2 3 4 5 6 2 2 2 1 1 3 1 1 1 1 7 8 1 • This set must be in the graph: {5,6} • Density of {1,2,3,4} = (3+2+2+2)/4 = 2.25– Doesn’t contain {5,6} • Density of {5,6,7,8} = 6/4 = 1.5 (Satisfies subset requirement) • Density of {1,2,3,4,5,6,7,8} = (2+3+2+2+1*7)/8 = 2.0 (Best answer) Polynomial time algorithm to compute the optimum solution
All Almost Dense Subgraph • A graph may contain multiple subgraphs of equal (or close to equal) density • Computing just one subgraph may not be sufficient • Compute all subgraphs close to maximum density • Extension of Picard and Queyranne’s result • Polynomial time algorithm to find almost all dense subgraphs given the number of such subgraphs is polynomial in the number of vertices. • Can be extended to consider both distance and subset restriction
All Almost Dense Subgraphs 1 2 3 4 5 6 2 2 2 1 1 2 3 1 1 1 1 9 7 8 • Density of {1,2,3,4} = 9/8 = 2.25 • Density of {5,6,7,8,9} = 11/5 = 2. • Density of {1,2,3,4,5,6,7,8,9} = 21/9 = 2.333 • The entire graph is the densest subgraph, but {1,2,3,4} and {5,6,7,8,9} are “almost” dense subgraphs 2 2
Tree Ontology: Distance Restricted 1 1 8 3 2 5 7 2 4 2 3 4 5 3 6 3 4 4 2 1 6 7 5 5 6 1 6 9 8 7 7 8 8 PO-Ontology GO-Ontology 9 Distance Threshold=2
Tree Ontology: Distance Restricted Distance Threshold=2 1 1 8 3 2 5 7 2 4 2 3 4 5 3 6 3 4 4 2 1 6 7 5 5 6 1 6 9 8 7 7 8 8 PO-Ontology GO-Ontology 9 Guess two nodes in each ontology that appears in the optimum solution and have maximum distance
Tree Ontology: Distance Restricted Distance Threshold=2 1 1 8 3 2 5 7 2 4 2 3 4 5 3 6 3 4 4 2 1 6 7 5 5 6 1 6 9 8 7 7 8 8 PO-Ontology GO-Ontology 9 Compute all the nodes which are within distance threshold from both the guessed nodes
Tree Ontology: Distance Restricted Distance Threshold=2 1 1 8 3 2 5 7 2 4 2 3 4 5 3 6 3 4 4 2 1 6 7 5 5 6 1 6 9 8 7 7 8 8 PO-Ontology GO-Ontology 9 In the gene-annotation bipartite graph consider only the chosen nodes and compute the densest subgraph
Tree Ontology: Distance Restricted Distance Threshold=2 8 3 5 7 2 4 2 4 5 6 3 4 2 1 6 7 5 5 6 1 9 8 7 PO-Ontology GO-Ontology 9 In the gene-annotation bipartite graph consider only the chosen nodes and compute the densest subgraph
Tree Ontology: Distance Restricted Distance Threshold=2 8 3 5 7 2 4 2 4 5 6 3 4 2 1 6 7 5 5 6 1 9 8 7 PO-Ontology GO-Ontology 9 In the gene-annotation bipartite graph consider only the chosen nodes and compute the densest subgraph
Tree Ontology: Distance Restricted Distance Threshold=2 8 3 5 7 2 4 2 4 5 6 3 4 2 1 6 7 5 5 6 1 9 8 7 PO-Ontology GO-Ontology 9 • Proof of optimality: • Any node not chosen can not be in the optimum solution • All the nodes chosen are within distance threshold
Distance Restricted Dense Subgraph • Guess a small subset of nodes from the optimum • Choose candidate nodes by considering distance from the guessed nodes • Compute the densest subgraph by restricting the gene annotation graph to only the chosen nodes
Following Goldberg’s algorithm (not explained here for brevity), a new graph, or network, is created with “directed” edges. The new graph can be thought of as a network of pipes in which water can flow only one way in each pipe. If edges were “undirected” (as in the previous graph) water could flow in both directions. The min cut is computed in order to find the densest subgraph. All nodes on the “source” side of the cut are part of the densest subgraph. (The source is where all the “water” flows from)
Background: What is a min cut? 1 1 1 3 1 1 sink source 1 1 1 2 4 1 1 1
Background: Find the Densest Subgraph 1 5 2 2 3 Original Graph:
Background: Finding the Densest Subgraph Edges from source to original nodes: m’= sum of all edges in graph Edge from original node i to sink: m’ + 2g – degree(i) 1 7 6 5 source 2 7 4 sink 2 3 Since the source is not the only node on the source side of the cut, the guess is too low. 9 7 g = guess = 2
Specified Set of Nodes in Densest Subgraph For this problem we modified Lawler’s method of finding densest subgraphs. Let’s assume that we have a graph in which we want to force {5,6} to be in the final solution.
Specified Set of Nodes in Densest Subgraph The guess “g” is iteratively updated, as in Goldberg’s algorithm until the min cut is calculated and there is more than one possible solution, one contains just {s’ and s} and the other specifies the densest subgraph.
Photomorphogenesis Experiment • 10 Photomorphogenesisgenes • CIB5 CRY2 HFR1 COP1 PHOT1 PHOT2 HY5 SHB1 CRY1 CIB1 • 66 GO CV terms. 41 PO CV terms; 2230 GO-PO edges. • Generate distance restricted dense subgraph. • GO distance = 2. • PO distance = 3. • Dense subgraph with 3 GO terms & 13 PO terms
(partial) dense subgraph; 3 GO terms; 13 PO terms; 10 genes 12 CIB5 26 CRY2 8 HFR1 COP1 13 PHOT1 13 PHOT2 12 HY5 13 2 SHB1 13 CRY1 0 annotation edges CIB1 13 PO CV terms 3 GO CV terms Set of 10 genes
Photomorphogenesis Experiment • GO CV Terms PO CV Terms • 5634-nucleus:cellular-component 13-cauline leaf:plant structure 9010-seed:plant structure • 5794-Golgi apparatus;cellular-comp 37-shoot apex:plantstruture 9025-leaf:plant structure • 5773-vacuole:cellular-component 8034-leaf whorl:plant structure 9031-sepal:plant structure • 9005-root;plant struture 9032-petal-plant structure • 9006- shhot:plant structure 9047-stem:plant structure • 9009-embryo;plant structure 20030-cotyledon:plant structure • 20038: petiole:plant structure • 5634-13 5634-37 5773-13 5773-37 • HFR1 (AT1G02340) 1 0 0 0 • CRY2 (AT1G04400) 1 1 1 1 • CIB5 (AT1G26260) 1 1 0 0 • COP1 (AT2G32950) 1 1 0 0 • PHOT1 (AT3G45780) 0 0 1 1 • CRY1 (AT4G08920) 1 1 0 0 • SHB1 (AT4G25350) 1 0 0 0 • HY5 (AT5G11260) 1 1 0 0 • PHOT2 (AT5G5840) 0 0 0 0 • CIB1 (AT4G34530) 0 0 0 0
Potential Discovery • Genes CRY2 and PHOT1 are both observed in the • dense subgraph with the following two GO and PO • combinations: • 5773: vacuole: cellular_component • 13: cauline leaf; plant_structure • 37: shoot apex; plant_structure • (5773, 13) • (5773, 37) • This patterns has not been reported in the literature. • Two independent studies [Kang et al. Planta 08, Ohgishi PNAS 04] have suggested that there may be some functional interactions between the members of PHOT1 and CRY2 in vacuole
Photomorphogenesis Experiment with Control Genes • Validation - Generate subset restricted dense subgraph. • Add 10 control genes. • 2 GO terms: 5634 and 5773. • 2 PO terms: 13 cauline leaf; plant_structure and 37 shoot apex. • Dense subgraph with 2 GO terms, 12 PO terms • User validated that the missing PO term and additional control genes and edges were acceptable changes from the distance restricted dense subgraph to the subset restricted dense subgraph.
Conclusion & Future Works.. • Identifying dense subgraphs with distance and subset restriction may help in identifying interesting biological patterns • Potential Applications in other domains: • Distance restricted dense subgraph for community detection • Subset restricted dense subgraph in PPI network for deriving protein complexes • Ranking almost all dense subgraphs