Chapter 5. Consumer Choice
Chapter 5. Consumer Choice. Utility Consumer surplus Budget Constraints Indifference Curves. I. Utility Analysis. what is utility? benefit you get from consuming a good determined by your tastes/preferences (assume these are stable). total utility (TU).

Chapter 5. Consumer Choice
E N D
Presentation Transcript
Chapter 5. Consumer Choice • Utility • Consumer surplus • Budget Constraints • Indifference Curves
I. Utility Analysis • what is utility? • benefit you get from consuming a good • determined by your tastes/preferences (assume these are stable)
total utility (TU) • total benefit from consuming good • example • total benefit from 3 cookies
TU 2 cookies TU 3 cookies • TU increases as consumption increases, to a point <
marginal utility (MU) • change in TU from consuming one more of a good • example • how much MORE utility from an additional pack of gum?
0 change in TU from 0 to 1 cookie MU of 1st cookie = change in TU from 1 cookie to 2 cookies = MU of 2nd cookie
diminishing marginal utility • MU falls as consumption rises • get sick of cookies
0 MU of 1st cookie > MU of 2nd cookie
TU cookie MU cookie TU rises at slower and slower rate as MU declines
How to maximize TU? • use available budget • equalize MU/$ across goods • Huh?
MU cookies MU milk = • chose combination of cookies and milk where price of cookies price of milk
why? • chose combo of 6 cookies, 1 milk • suppose MU/$1 of cookies = 4, MU/$1 of milk = 15 • by consuming fewer cookies, more milk… I would add more to my TU
TU vs. MU • Diamond-Water paradox • $10,000 • one carat diamond • 5 million gallons of tap water
why? • TU of water is greater than TU of diamonds • water is essential for life • BUT water is abundant, diamonds are rarer • MU of last diamond is higher • MU determines value
MU and demand • MU declines as consumption rises • willing to pay less for each additional unit • downward sloping demand
P willing to pay $15 $15 $10 willing to pay $10 D Q 2 pizza 4 pizzas example : pizza for 2nd pizza for 4th pizza
II. Consumer Surplus • difference between what you pay for a good, any what you are WILLING to pay for a good
example • market price pizza = $10 • my marginal value of 3rd pizza this week = $12 • my consumer surplus = $2
P $12 my consumer surplus $10 D Q 3 my demand curve
total consumer surplus P $10 D Q 10,000 area between D and price of pizza
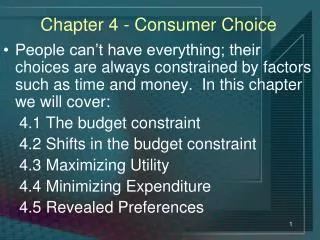
III. The Budget Line • given: • consumer’s budget • prices • draw a line representing choices • consumption possibilities
example • 2 goods: milk & cookies • bottle of milk = $1 • cookie = $.50 • daily budget = $4
milk cookies possible combinations 0 2 4 6 8 4 3 2 1 0
8 6 4 2 0 1 2 3 4 budget line cookies milk
8 6 4 2 0 1 2 3 4 budget line cookies Unaffordable Affordable milk
what if prices change? • changes slope of budget line • suppose cookies = $1
cookie = $.50 8 6 cookie = $1 4 2 0 1 2 3 4 budget line cookies milk
what if budget changes • budget line shifts • suppose budget = $5
10 8 6 budget = $5 4 budget = $4 2 0 1 2 3 4 5 cookies milk
IV. Indifference Curves • (appendix) • alternative way to show utility • curve shows combo of goods that deliver same total utility
8 6 4 2 Indifference curve 0 1 2 3 4 example: milk and cookies cookies Every point on curve has same total utility milk
higher TU lower TU TU is higher as curve shifts right cookies milk
consumer equilibrium • maximize TU • stay on budget
cookies 8 4 milk 4 2 consumer equilibrium best affordable point
cookies 8 4 milk 4 2 consumer equilibrium best affordable point
sum it up • consumer decisions based on • preferences • budget constraint • consumer decisions made at the margin • marginal benefit of one more • compared to price of one more