
Bandmerging in Spitzer-Pleiades Data: Enhancing Source Catalog Reliability
E N D
Presentation Transcript
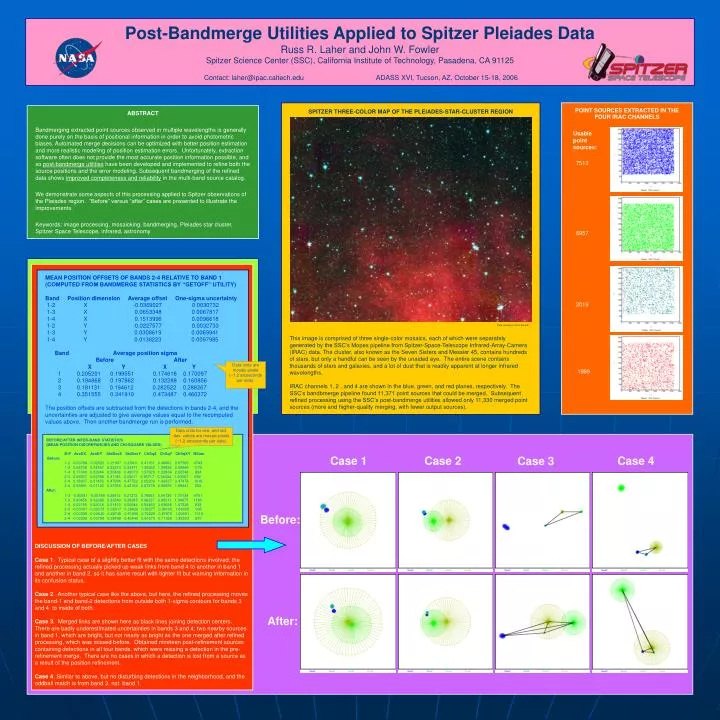
This image is comprised of three single-color mosaics, each of which were separately generated by the SSC’s Mopex pipeline from Spitzer-Space-Telescope Infrared-Array-Camera (IRAC) data. The cluster, also known as the Seven Sisters and Messier 45, contains hundreds of stars, but only a handful can be seen by the unaided eye. The entire scene contains thousands of stars and galaxies, and a lot of dust that is readily apparent at longer infrared wavelengths.IRAC channels 1, 2 , and 4 are shown in the blue, green, and red planes, respectively. The SSC’s bandbmerge pipeline found 11,371 point sources that could be merged. Subsequent refined processing using the SSC’s post-bandmerge utilities allowed only 11,330 merged point sources (more and higher-quality merging, with fewer output sources). POINT SOURCES EXTRACTED IN THE FOUR IRAC CHANNELS SPITZER THREE-COLOR MAP OF THE PLEIADES-STAR-CLUSTER REGION Usable point sources: 7513 Post-Bandmerge Utilities Applied to Spitzer Pleiades DataRuss R. Laher and John W. FowlerSpitzer Science Center (SSC), California Institute of Technology, Pasadena, CA 91125 Contact: laher@ipac.caltech.edu ADASS XVI, Tucson, AZ, October 15-18, 2006 6957 DISCUSSION OF BEFORE/AFTER CASES Case 1. Typical case of a slightly better fit with the same detections involved; the refined processing actually picked up weak links from band 4 to another in band 1 and another in band 2, so it has same result with tighter fit but warning information in its confusion status. Case 2. Another typical case like the above, but here, the refined processing moves the band-1 and band-2 detections from outside both 1-sigma contours for bands 3 and 4 to inside of both. Case 3. Merged links are shown here as black lines joining detection centers. There are badly underestimated uncertainties in bands 3 and 4; two nearby sources in band 1, which are bright, but not nearly as bright as the one merged after refined processing, which was missed before. Obtained nineteen post-refinement sources containing detections in all four bands, which were missing a detection in the pre-refinement merge. There are no cases in which a detection is lost from a source as a result of the position refinement. Case 4. Similar to above, but no disturbing detections in the neighborhood, and the oddball match is from band 3, not band 1. MEAN POSITION OFFSETS OF BANDS 2-4 RELATIVE TO BAND 1 (COMPUTED FROM BANDMERGE STATISTICS BY “GETOFF” UTILITY)Band Position dimension Average offset One-sigma uncertainty 1-2 X -0.0369027 0.0030732 1-3 X 0.0653348 0.0067817 1-4 X 0.1513996 0.0096618 1-2 Y -0.0227577 0.0032733 1-3 Y 0.0308619 0.0069941 1-4 Y 0.0138223 0.0097985 Band Average position sigma Before After X Y X Y 1 0.205201 0.199551 0.174618 0.170097 2 0.194868 0.197862 0.132288 0.160856 3 0.181131 0.194612 0.282522 0.288267 4 0.351555 0.341910 0.473487 0.460372 The position offsets are subtracted from the detections in bands 2-4, and the uncertainties are adjusted to give average values equal to the recomputed values above. Then another bandmerge run is performed. 2019 Data courtesy of John Stauffer. Data units are mosaic pixels (~1.2 arcseconds per side). 1999 ABSTRACT Bandmerging extracted point sources observed in multiple wavelengths is generally done purely on the basis of positional information in order to avoid photometric biases. Automated merge decisions can be optimized with better position estimation and more realistic modeling of position estimation errors. Unfortunately, extraction software often does not provide the most accurate position information possible, and so post-bandmerge utilities have been developed and implemented to refine both the source positions and the error modeling. Subsequent bandmerging of the refined data shows improved completeness and reliability in the multi-band source catalog. We demonstrate some aspects of this processing applied to Spitzer observations of the Pleiades region. “Before” versus “after” cases are presented to illustrate the improvements. Keywords: image processing, mosaicking, bandmerging, Pleiades star cluster, Spitzer Space Telescope, infrared, astronomy Data units for ave. and std. dev. values are mosaic pixels (~1.2 arcseconds per side). BEFORE/AFTER INTER-BAND STATISTICS (MEAN POSITION DISCREPANCIES AND CHI-SQUARE VALUES) B-P AveDX AveDY StdDevX StdDevY ChSqX ChSqY ChSqXY NSum Before: 1-2 -0.03788 -0.02522 0.21907 0.23411 0.41161 0.46603 0.87565 4743 1-3 0.06738 0.04367 0.33213 0.33471 1.35252 1.29926 2.65969 1170 1-4 0.17040 0.02944 0.50466 0.49079 1.37929 1.22884 2.60548 834 2-3 0.09337 0.03768 0.31196 0.33011 0.95717 0.94334 1.90307 992 2-4 0.18607 0.01456 0.47994 0.47722 2.02209 1.43937 3.47478 1018 3-4 0.06891 -0.01142 0.37556 0.42162 0.87378 0.98559 1.85641 652 After: 1-2 -0.00081 -0.00188 0.20912 0.21273 0.76063 0.94136 1.70134 4751 1-3 0.00456 0.02288 0.33349 0.38245 0.96237 0.98211 1.94875 1185 1-4 0.02165 0.02018 0.51410 0.50644 0.93493 0.93828 1.87326 833 2-3 -0.00301 -0.02370 0.32617 0.36626 0.88277 0.98109 1.86635 995 2-4 -0.00335 -0.02540 0.49740 0.51890 0.72225 0.87970 1.60501 1019 3-4 -0.02308 0.00798 0.38498 0.45440 0.61075 0.71369 1.32363 657 Case 1 Case 2 Case 4 Case 3 Before: An example CGI script from the DQA software suite After:


