Nov. 15 - Inequalities in Two Variables
170 likes | 189 Views
Algebra 1<br>middle school math<br>high school math

Nov. 15 - Inequalities in Two Variables
E N D
Presentation Transcript
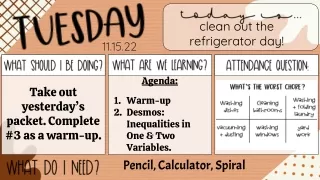
clean out the refrigerator day! 11.15.22 Agenda: • Warm-up • Desmos: Inequalities in One & Two Variables. Take out yesterday’s packet. Complete #3 as a warm-up. Pencil, Calculator, Spiral
3. Marty wants to get over 9000 comments on his YouTube videos. He gets 750 comments for each cat video that he uploads and he gets 450 comments for each dog video that he uploads. Write and graph the inequality that models this situation. Variables: Inequality: a. If Marty only uploads cat videos, how many would he need to get over 9000 comments? b. If Marty uploads 6 cat videos and 10 dog videos, will he get the amount of comments that he wants? How does the graph demonstrate your answer? c. Make three inferences from the graph that you created.
3. Marty wants to get over 9000 comments on his YouTube videos. He gets 750 comments for each cat video that he uploads and he gets 450 comments for each dog video that he uploads. Write and graph the inequality that models this situation. Variables: Inequality: x = number of cat videos y = number of dog videos a. If Marty only uploads cat videos, how many would he need to get over 9000 comments? b. If Marty uploads 6 cat videos and 10 dog videos, will he get the amount of comments that he wants? How does the graph demonstrate your answer? c. Make three inferences from the graph that you created. 750x + 450y > 9000 He would need to upload more than 12 videos. He would need to upload 13 or more videos. 750x+450(0)>9000 750x>9000 x>12 24 20 16 12 8 4 number of dog videos He would not get the amount of comments. This point is on the line. Since the line is dashed, (6,10) is not a solution. That would give him exactly 9000 comments, but he wants over 9000. Uploading 20 cat videos and 4 dog videos will give him enough comments. Uploading 6 cat videos and 6 dog videos will not give him enough comments. If he uploads 24 dog videos he will have enough comments. 4 8 12 16 20 24 number of cat videos
Inequalities >>>>>>>>>>>>> >>>>>>>>>>>>>
4. Grandma has a maximum of 30 batteries for the grandkids birthday toys. Each toy helicopter uses 3 batteries and each toy car uses 4 batteries. Write and graph the inequality that models this situation. Variables: Inequality: a. If Grandma doesn’t let the kids play with the toy helicopters, what is the most number of toy cars that the kids can play with? b. Does Grandma have enough batteries for the grandkids to play with 5 toy helicopters and 4 toy cars? How does the graph support this answer? c. What are three combinations of batteries that will allow the grandkids to play with birthday toys?
4. Grandma has a maximum of 30 batteries for the grandkids birthday toys. Each toy helicopter uses 3 batteries and each toy car uses 4 batteries. Write and graph the inequality that models this situation. Variables: Inequality: x = number of helicopters y = number of cars a. If Grandma doesn’t let the kids play with the toy helicopters, what is the most number of toy cars that the kids can play with? b. Does Grandma have enough batteries for the grandkids to play with 5 toy helicopters and 4 toy cars? How does the graph support this answer? c. What are three combinations of batteries that will allow the grandkids to play with birthday toys? 3x + 4y < 30 3(0)+4y<30 4y<30 y<7.5 The most number of helicopters they could play with is 7. 12 10 8 6 4 2 number of cars She does not have enough batteries. The graph supports this because the point (5,4) is not in the shaded region. 3(5)+4(4)<30 31<30 false 5 helicopters and 1 car 2 helicopters and 3 cars 1 helicopter and 6 cars 2 4 6 8 10 12 number of helicopters
5. Andre wants to waste less than 175 gallons of water this week. Every day that he waters the lawn, he wastes 59 gallons of water. Every day that he washes his car, he wastes 28 gallons of water. Write and graph the inequality that models this situation. Variables: Inequality: a. If Andre washes his car twice, what is the most number of times he can water his lawn? How does the graph support this answer? b. If Andre does not water his lawn, what is the most number of times that he could wash his car? Support this answer using the inequality instead of the graph. c. Make three inferences from your graph.
5. Andre wants to waste less than 175 gallons of water this week. Every day that he waters the lawn, he wastes 59 gallons of water. Every day that he washes his car, he wastes 28 gallons of water. Write and graph the inequality that models this situation. Variables: Inequality: x = number of times he waters the lawn y = number of times he washes the car a. If Andre washes his car twice, what is the most number of times he can water his lawn? How does the graph support this answer? b. If Andre does not water his lawn, what is the most number of times that he could wash his car? Support this answer using the inequality instead of the graph. c. Make three inferences from your graph. 59x + 28y < 175 59x+28(2)<175 59x<119 x<2.02 Andre could water his lawn twice at the most. The point (2,2) falls within the shaded region of the graph. 12 10 8 6 4 2 number of times he washes the car Andre could wash his car 6 times at the most. 59(0)+28y<175 28y<175 x<6.25 Andre could water the lawn once and wash his car once. He cannot water the lawn 4 times. He could water the lawn once and wash his car 3 times. 1 2 3 4 5 6 number of times he waters the lawn
6. Bryan works as a paleontologist and a sculptor. He hopes to earn at least $50,000 this year. He makes $5500 each month as a paleontologist and $4500 each month as a sculptor. Write and graph the inequality that models this situation. Variables: Inequality: a. If Brian worked 6 months as a paleontologist this year, what is the minimum number of months he must work as a sculptor to reach his goal? Support this answer using the inequality instead of the graph. b. List three combinations that Brian could do to reach his goal. c. If Brian takes the year off of paleontology, what is the minimum number of months he must work to reach his goal? How does your graph support this answer?
6. Bryan works as a paleontologist and a sculptor. He hopes to earn at least $50,000 this year. He makes $5500 each month as a paleontologist and $4500 each month as a sculptor. Write and graph the inequality that models this situation. Variables: Inequality: x = number of months working as paleontologist y = number of months working as sculptor a. If Brian worked 6 months as a paleontologist this year, what is the minimum number of months he must work as a sculptor to reach his goal? Support this answer using the inequality instead of the graph. b. List three combinations that Brian could do to reach his goal. c. If Brian takes the year off of paleontology, what is the minimum number of months he must work to reach his goal? How does your graph support this answer? 5500x + 4500y > 50000 5500(6)+4500y>55000 4500y>22000 y>4.88… Brian must work at least 4.88 months. The point (6,4.88) falls within the shaded region of the graph. number of months working as sculptor 1 paleontologist and 8 sculptor 3 paleontologist and 4 sculptor 7 paleontologist and 1 sculptor 2 4 6 8 10 12 Brian must work at least 11.11 months as a sculptor to reach his goal. The point (0,11.11) falls on the line of the graph and it can be on the line to earn at least $50000. 1 3 5 7 9 11 number of months working as paleontologist
7. A truck that can carry no more than 6400 pounds is being used to transport refrigerators and upright pianos. Each refrigerator weighs 250 pounds and each piano weighs 475 pounds. Write and graph an inequality to show how many refrigerators and how many pianos the truck could carry. Variables: Inequality: a. Will 12 refrigerators and 8 pianos overload the truck? Explain. b. Identify 3 combinations of refrigerators and pianos that the truck can carry. c. What is the most pianos that the truck could carry at one time? Would the truck be able to also include just one refrigerator? Explain why or why not.
7. A truck that can carry no more than 6400 pounds is being used to transport refrigerators and upright pianos. Each refrigerator weighs 250 pounds and each piano weighs 475 pounds. Write and graph an inequality to show how many refrigerators and how many pianos the truck could carry. Variables: Inequality: x = number of refrigerators y = number of upright pianos a. Will 12 refrigerators and 8 pianos overload the truck? Explain. b. Identify 3 combinations of refrigerators and pianos that the truck can carry. c. What is the most pianos that the truck could carry at one time? Would the truck be able to also include just one refrigerator? Explain why or why not. 250x + 475y < 6400 250(12)+475(8)<6400 3000 + 3800<6400 6800<6400 The truck would be overloaded by 400 pounds with 12 refrigerators and 8 pianos. 3 refrigerators and 10 pianos 9 refrigerators and 6 pianos 21 refrigerators and 2 pianos number of upright pianos 2 4 6 8 10 12 14 The truck would be able to carry 13 pianos at most for a total of 6175 pounds. The truck could not add a refrigerator because it would then be overweight by 25 pounds. 3 9 15 21 27 33 number of refrigerators
8. You and some friends have $30. You want to order large pizzas (p) that are $9 each and drinks (d) that are $1 each. Write and graph an inequality that shows how many pizzas and drinks you can order. Variables: Inequality: a. Can you order 3 large pizzas and 6 drinks? Explain why or why not. b. Identify 3 combinations of pizzas and drinks that can be ordered. c. Do you have enough money to support purchasing 2 pizzas and 8 drinks? Explain using the graph to support your answer.
8. You and some friends have $30. You want to order large pizzas (p) that are $9 each and drinks (d) that are $1 each. Write and graph an inequality that shows how many pizzas and drinks you can order. Variables: Inequality: x = number of large pizzas y = number of drinks a. Can you order 3 large pizzas and 6 drinks? Explain why or why not. b. Identify 3 combinations of pizzas and drinks that can be ordered. c. Do you have enough money to support purchasing 2 pizzas and 8 drinks? Explain using the graph to support your answer. 9x + 1y < 30 No, you cannot order 3 pizzas and 6 drinks. This would cost $3 more than the amount you have to spend. 9(3)+1(6)<30 27 + 6 < 30 33 < 30 number of drinks 3 pizzas and 3 drinks 2 pizzas and 9 drinks 1 pizza and 18 drinks 3 6 9 12 15 18 21 24 27 30 33 9(2)+1(8)<30 18 + 8 < 30 26 < 30 Yes, you can purchase 2 pizzas and 8 drinks for a total of $26. 1 2 3 4 5 6 number of large pizzas
Create a Problem: Variables: Inequality: a. b. c.
Delta Math Time