Modeling Uncertainty: Probability Distributions in Decision Making
350 likes | 376 Views
Understand probability distributions to characterize uncertainty in decision-making processes. Learn about concepts like Normal Distribution and measures of risk.

Modeling Uncertainty: Probability Distributions in Decision Making
E N D
Presentation Transcript
Modeling Uncertainty:Probability Distributions Lonnie Chrisman, Ph.D.Lumina Decision SystemsAnalytica User Group Webinar SeriesSession 2: 6 May 2010
Today’s Topics • Review • How can we characterize uncertainty for continuous quantities? • The Normal Distribution • Viewing & interpreting • LogNormal Distribution • Why include uncertainty
Course Syllabus(tentative) Over the coming weeks: • What is uncertainty? Probability. • Probability Distributions (today) • Monte Carlo Sampling • Measures of Risk and Utility • Common parametric distributions • Assessment of Uncertainty • Risk analysis for portfolios • (risk management) • Hypothesis testing
What is Uncertainty? • Uncertainty: the lack of perfect and complete knowledge. • Applies to: • Future outcomes • Existing states or quantities • Physical measurements • Unknowable (quantum mechanics) • Exercise: State something that you have perfect and complete knowledge of.
Related Concepts • Randomness • Will by next coin toss be heads or tails? • Variation • 75% of the people in this room have type A blood. • Vagueness • How many people worldwide live in warm climates? • Risk • You could die during the operation. • Statistical Confidence/Significance • The study confirmed the hypothesis at a 95% confidence level.
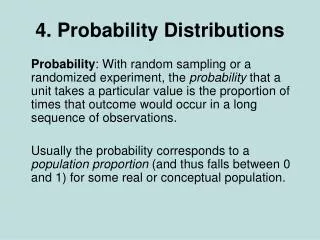
Probability: A language for uncertainty Probability: A measure for how certain, on a scale from 0 to 1, a statement is to be true. • P(A)=0 : Assertion A is certainly false. • P(A)=1 : Assertion A is certainly true. • P(A)=0.5: Equally likely to true or false. • P(A)=0.7: A is more likely true than false.
Assertions must be Crisp and Unambiguous Probability of what? • Must be a true/false assertion. • Vagueness not allowed. ✘ “Gas prices will increase substantially in the short term.” ✔ “The average retail price for regular unleaded gas in the state California, as reported by the U.S. Energy Information Administration, will increase by more than 20% from 26 Apr 2010 to 30 Aug 2010.” • Truth theoretically knowable
Boolean Chance Variablesin Analytica • Characterized by a single probability – P(B=true). • Examples: • Component fails • Dow drops by >1000 points • Civil war breaks out in Nigeria • Subject is male • Use Chance variable defined as • Bernoulli(p)
“Subjective” Interpretation of Probability • Probabilities measure: • how much what we know. • not frequency of occurrence. • Calibration: • Over many probability assessments, the frequency of true assertions should match our subjective probabilities for the assertions.
Continuous Quantities • Most variables in quantitative models represent real-valued quantities.Examples: • Revenue • Infection rate • Oil well capacity • Megawatt power output • Unit sales (?) • Saying “Probability of x”, or P(x), is nonsensical. • We need something more…
Real-valued uncertainty example At this time (6 May 2010), at what rate (in gallons per hour) is oil leaking into the Gulf of Mexico from the well in Louisiana that exploded on 22 Apr 2010? • Does this pass the clarity test? • How can we express or knowledge and degree of uncertainty regarding the true value? Note: A CNN article gave an estimate of 8,300 gal/hr.
Ways to Expressing Uncertainty(Attendees ideas) Rate of Oil leak: • Minimum & maximum values • Standard deviation • Mean + Median (if different) • Distribution, e.g, triangular with 10% + 90% percentiles.
Average Deviation Suppose our “best guess” is: E[ oil_leak_rate ] = 10K gal/hr • What is the expected error in our estimate? = E[ |10K – trueValue| ] • Ave. dev. is a simple (intuitive?) one-number measure of how uncertain we are. • Allows us to characterize our knowledge / uncertainty with just two numbers: • Expected value + Expected deviation Aka: Expected Deviation, (mean/average) Absolute deviation.
Standard Deviation • Other measures of uncertainty “dispersion”: • Variance (expected/average squared error): = E[ (10K – trueValue)2 ] • Standard Deviation = • Standard deviation has the same intuitive meaning as average (absolute) deviation. • Both are a type of best guess for how much error our best guess has. • Nicer mathematical properites • More commonly used.
Standard Deviation vs. Average Deviation • Both are always non-negative. • Zero indicates absolute certainty. • Both are measured in the same units as x. • Q: Which measure gets larger when extreme errors are more likely? • What is the typical ratio sd/ad? • Symmetric: sd ≈ 1.25 ad • One-sided tail: sd ≈ 1.35 ad • “Heavy” tails: (up to) 1.3 ad ≤ sd ≤ 2.5 ad
Expressing uncertainty for a real-valued quantity • Expected value + dispersion measure, e.g.: • Expected value + average deviation • Expected value + standard deviation • Exercise: Express your uncertainty for the oil well leak example in the above forms. • There are no probabilities here. Why?
VisualizationNormal Distribution This is called a probability densityfunction (PDF) plot. ExpectedValue Avedev. EV=10KAD=3K SD =3.8K Stddev.
VisualizationNormal Distribution 58% of areawithin 1 averagedeviation. +/- Ave Deviation EV=10KAD=3K SD =3.8K The connection to probability.
VisualizationNormal Distribution 68% of areawithin 1 averagedeviation. +/- Std Deviation EV=10KAD=3K SD =3.8K
Cumulative Probability Function (CDF) • Easier to read than PDF. • P(rate≤x)
Specifying the Normal Distribution in Analytica • Define your real-valued variable as: Normal( mean, stddev ) Take note: Standard Deviation, not expected/average deviation.Remember to increase slightly (e.g., 25%)when estimating.
Exercise A toy company must decide how many toys to manufacture for the Christmas season three months in advance. Demand is: Normal(100K,25K) It costs $5 to manufacture a toy. The company makes a $10 profit on each toy sold. They order 100K toys. What is their expected profit?
Exercise <cont> Using the toy company example: • Compare estimated profit when uncertainty is ignored (based on Mean demand) to mean profit. • Examine how mean profit varies with the number of toys ordered: Units_ordered := Sequence(70K,130K,1K) • What size order should they place? • What improvement in value results from including explicit uncertainty in the model?
Positive real-valued quantities • Many real-valued quantities are positive-only, but no hard upper limit: • Oil leak rate • Demand • Population counts • Stock prices • Multiplier for positive quantity • Capacities • Normal distribution allows negative values.
Nonsense negatives Negative oil leak? Nearly impossible?
LogNormal Distribution Mode • Positive values only. • Positive skew (most values to right of mode) • Multiple possible “central” estimates. Median Mean
Specifying a LogNormal LogNormal(median,gsdev,mean,stddev) • You specify any two of these: • Median: 50th percentile – “typical value” • Mean: Average value • Gsdev: geometric standard deviation • Stddev: (Arithmetic) standard deviation • When using LogNormal, use named-parameter syntax, e.g.: • LogNormal(mean:10K,stddev:3.8K) • LogNormal(median:9350,mean:10K)
Exercise A mining company obtains rights to extract a gold deposit during a one-week window next year, before a construction project starts on the site. Extracting the deposit will cost $900K. The size of the deposit: LogNormal(Mean:1K,Stddev:300) oz. The price of gold next year: LogNormal(Mean:$1K, stddev:$500) What is the expected value of these mining rights? Compare to result ignoring uncertainty.
How important is choice of distribution? Exercise: • Modify mining example to use Normal instead of LogNormal, same mean & stddev. • How much does this change the result?
Compare Normal to LogNormal These have the same mean and same standard deviation.
The Flaw of Averages • Who is this guy? A: Sam Savage, author of: An entertaining account of the distortionscaused by average-case analysis.
Why model uncertainty explicitly? • Misleading results otherwise… “Flaw of averages” • Explicit “precision” of results. • Some decisions are about uncertainty. E.g., • to gather more information • contingency planning • Improved combining of information sources. • Productivity: Probabilities & distributions can often be estimated more quickly than expected values (!) • Sensitivity analyses • Causal modeling & abduction (diagnostic reasoning)
What we covered • Uncertainty about continuous quantities can be largely characterized by: • Central value (e.g., mean or median) • Dispersion measure (expected deviation, standard deviation, variance, geometric standard deviation). • Normal distribution – unbounded quantities • LogNormal distribution – positive quantities