Download
1 / 1
10 likes | 158 Views
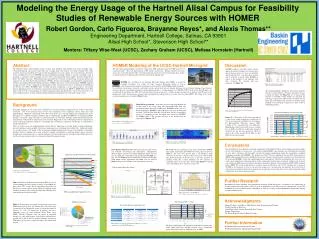
Modeling the Energy U sage of the Hartnell Alisal C ampus for Feasibility S tudies of R enewable E nergy S ources with HOMER. Robert Gordon, Carlo Figueroa, Brayanne Reyes*, and Alexis Thomas** Engineering Department, Hartnell College , Salinas, CA 93901

E N D
Modeling the Energy Usage of the Hartnell Alisal Campus for Feasibility Studies of Renewable Energy Sources with HOMER Robert Gordon, Carlo Figueroa, BrayanneReyes*, and Alexis Thomas**Engineering Department, Hartnell College, Salinas, CA 93901 Alisal High School*, Stevenson High School** Mentors: Tiffany Wise-West (UCSC), Zachary Graham (UCSC), Melissa Hornstein (Hartnell) Abstract The Hartnell College Alisal Campus consists of three main buildings with multiple space types including office, electrical/mechanical, classrooms, lecture halls and a training shop, each with its own energy demands. The energy needed to operate and condition these spaces results in significant costs to the campus. Our research project, directed by UCSC and Hartnell, was to use HOMER microgrid optimization modeling software to conduct a feasibility study of installing a renewable energy microgrid system to offset conventional grid power supplies, thereby reducing Green House Gas (GHG) emissions. With firsthand data unavailable due to the lack of submetering, we instead gathered and analyzed raw data from Pacific Gas and Electric (PG&E), National Oceanographic and Atmospheric Administration (NOAA), the National Renewable Energy Laboratory (NREL), and various vendor specifications. HOMER simulates varying renewable resource configurations and prioritizes energy systems based on lowest cost kilowatt hour (kWh) and Net Present Cost (NPC). HOMER reports on GHG emissions, though this is not its primary purpose. Our models indicate diminishing return on investment as local power generation increases past 400kW. A 400kW Photovoltaic (PV) plant would cover the existing parking lots without impacting usable agricultural land. Our research represents a tool for the administration to consider in future planning and planned implementation of renewable energy sources. Discussion HOMER Modeling of the UCSC-Hartnell Microgrid The three main campus buildings, which were completed in 2009, total approximately 55,000 square feet of conditioned space. There are approximately 1,300 students at peak time. Energy demand comes from various space types that include office, electrical mechanical, classrooms, lecture and training shop. A large secondary load is the welding and dust collection system in the training shop. HOMER compares renewable energy options against the baseline demand costs of grid power and list them in order of lowest cost per kWh and Net Present Cost.. Any individual scenario can be analyzed in depth within HOMER in respect to the variables of cost summary, cash flow, electrical, PV, converter, grid and emissions. See Figure 10. HOMER was developed by the National Renewable Energy Lab (NREL) to model the economic advantages of a variety of energy scenarios. Renewable energy, as well as conventional power generating technologies, can be modeled with HOMER, which determines Figure 10: HOMER Optimization Results Source: Actual screenshot of HOMER howdifferent conventional, renewable, and hybrid systems interact with end-use demand. Keeping end-use demand unchanged (noefficiency measures taken) we ran multiple microgrid scenarios limiting all runs to varying quantities of UGE 4kW VAWT (Vertical Axis Wind Turbine), one of which will be installed in late 2012, PV array and battery storage system sizes. A further design constraint was to limit our solar PV array to the parking area square footage in lieu of using usable agricultural land which results in a system of no more than 400kW. The details of the various system component costs are included Table 1 below. After running multiple simulations with various quantities and sizes of wind turbines, PV arrays and battery storage, a pattern developed. See Figure 11. As we increased the amount of renewable energy within our microgrid the percentage of grid power offset by the renewables was not linear. The relationship of the amount of renewable energy installed to the percentage of grid power offset results in diminishing returns. Background Hartnell Energy Demand : At the time of our research study Hartnell did not have time of day energy usage data with PG&E utility bills only providing monthly sum totals of kWh used. HOMER requires data on a hourly usage basis. HOMER requires kW figures for every weekday and weekend Off-Peak, Part-Peak and On-Peak hour. An Excel spreadsheet was used to extrapolate needed data which were entered into HOMER. See Figures 4 & 5. The seasonal and hour of day demand data are represented in Figures 6 & 7. Nationally, buildings are one of the major contributors to electricity demand resulting in the use of 40% of all energy consumed. 18% of the national total is used by the commercial sector comprising schools, office space and manufacturing. Within the commercial sector, 50% of this power goes towards lighting and conditioning the space through the use of HVAC (heating, ventilation, and air conditioning). In 2007 and 2008, Ecos Consulting and RLW Analytics conducted a plug load study in commercial offices in California. Findings demonstrated that plug loads consumed up to 30 percent of commercial sector electricity. Plug loads are one of the human behavior components of energy demand and efficiency which are not normally part of efficiency calculations, but become very important in demand management. There are many reasons for making buildings energy efficient. Improving an existing facility’s energy performance provides immediate and measurable reductions in operational costs resulting in lower utility bills. Additional benefits are a) improvements to the quality of the environments making building spaces become more habitable, comfortable, healthier, easier to maintain and a more productive learning environment, b) achieving climate change objectives through lower carbon emissions, c) creating employment by increasing local jobs to install energy efficient measures, and d) increasing energy security by reducing our demand for imported energy. Figure 11: Renewables to grid power offset diminishing return Source: Gordon & Figueroa Electrical Cost per kWh Figure 5: Hartnell Cost of Electricity per kWh Source: Screenshot of actual HOMER data • Figure 12: A University of Wisconsin study placed a value of air quality benefits per avoided ton of CO2 at an average price of $40 per ton. According to the Environmental Protection Agency (EPA) 1.384lbs of CO2 is produced for every kWh used. Multiplication of the factors yields an excess hidden cost of $0.03 per kWh for traditionally generated electricity. To put this into perspective, $0.03 is equal to 20% of the average $0.145 kWh cost that Hartnell is presently paying. Figure 4: PG&E E-19 Rate kW demand charges Source: Screenshot of actual HOMER data Conclusions Figure 6: Actual screenshot of HOMER data Source: Hartnell PG&E monthly electric bills Figure 7: Actual screen shot of HOMER data Source: Hartnell PG&E monthly electric bills Our determination of an optimally sized ideal configuration of the Hartnell College Alisal campus micro-grid confirms the fit of our methods to our objectives. Our method, using HOMER, a grid simulator, was sufficiently powerful that we were able to determine with reasonable certainty that optimal configuration despite the unavoidably secondhand preliminary data input into HOMER. The optimal size of the PV plant to supplement the new 4kW wind generator is 400kW while relying on the current PG&E grid connection to balance demand and the variability of on-site production. By analyzing HOMER's results and supplementing them with analysis of hidden environmental and social costs, we made a more comprehensive financial analysis of the existing grid situation than is customary, with the result of greater cost-savings and GHG emission reductions than those customarily obtained. Our recommended 4kW VAWT combined with a 400kW PV system would amount to a annual savings of 160 metric tons of CO2 emissions and a savings of $73,000 in electrical power. Great as our projected savings were, environmental and financial, they would only be increased by investment in the means to generate site-specific time-of-use prime data, such as submetering and regular reapplication of our grid simulation method. Wind Turbine Model: Monthly wind speed data was derived from raw National Aeronautical and Atmospheric Administration (NOAA) figures specific to the Salinas Municipal Airport. Our raw data was input into a spreadsheet and uploaded into HOMER as a text file. See Figure 8 for an annual projected wind speed graph. Wind turbine capital, replacement and O&M costs are listed in Table 1. The projected lifetime of the wind turbine is 25 years. PV Array: We ran simulations using arrays of 4kWthru 1400kW. The capital, replacement and O&M costs of the panels are listed in Table 1. PV costs were derived from a UC Berkeley study, “Tracking the Sun IV,” a report on PV systems from 1998 to 2010. The projected lifetime of the PV arrays is 25 yearsand have no tracking system due to their additional cost. PV generates its maximum output at the same time as the graph (Figure 8) demand curve, offsetting the most expensive energy costs. Efficiency and Renewable Investment Graph Salinas Annual Wind Speed Data HOMER Microgrid Energy Usage of a Typical Building Source: http://exergycontrols.com/lightingenergy.html Further Research Benchmark all campus buildings using Department of Energy (DOE) EnergyStar . In addition to the submetering of electric demand one would realize savings as great if submetering of gas and water were implemented. Acquire PV installation costs from qualified vendors. Installation of time-of-use energy demand dashboard to help modify building occupant human behavior. Figure 1 Illustrates the Return on Investment (ROI) in years of various building efficiency retrofits as well as a typical ROI of a photovoltaic (PV) system. Before considering renewables, the first step is to always address energy efficiency. Applying energy efficiency measures offers a faster pay back than offsetting those same inefficiencies with renewables. Figure 2 Demonstrates the average mixed energy sources that PG&E delivers in the State of California. Most all of the energy is generated by Non Renewable sources of energy that cannot be replaced (i.e. coal, oil, natural gas & nuclear) and are a significant source of ozone depleting Green House Gases (GHG). Though California leads the nation is renewable energies, (i.e. sun, wind, biomass, hydroelectric, tidal and wave) we will only be able to decrease, and not eliminate, emissions of GHG unless we are able to completely remove the campus from the grid. Time (years) Figure 1. ROI of efficiency retrofits and typical PV systems Source: Stanford Energy Lecture 1: Buildings; Amory Lovins Figure 9: Screenshot of actual HOMER data Source: NREL solar data specific to Latitude 36 / Longitude 121 Figure 8: Screenshot of actual HOMER data Source: National Climate Data Center (Div. of NOAA) Acknowledgments Population and kW vs. Time PG&E Power Sources Renewable Energy Component Costs Hartnell College: Joseph Reyes, Mike Thomas, Andy Newton, Brenda Thrasher PG&E: Dan Waters, Rob Cruz, Alisal High School: Jennifer Westerbeck, Ron Contreras Editing: Stuart Koster Dr. Phoebe Helm, President of Hartnell College Further Information Dr. Michael Isaacson: msi@soe.ucsc.edu Dr. Melissa Hornstein: mhornstein@hartnell.edu Table 1. Details of the capital, replacement and O&M costs of various equipment types in the HOMER simulations The above graphdisplays the population of the Alisal Campus using actual Spring 2012 class schedule and kW energy consumption against time. School opens at 8AM and closes at 10PM. Figure 2 Energy mix of grid power in California Source: PG&E