Download
1 / 41
410 likes | 429 Views
Explore the effectiveness of the Estuary Enhancement Program at the Delaware Estuary in mitigating fish losses from cooling water intakes. Assess wetland restoration, fish ladders, and marsh enhancement to boost fish production.

E N D
Mitigating for Cooling Water Intakes – Is the Estuary Enhancement Program of DE Bay Working? Carpenter Environmental Associates, Inc. Ralph E. Huddleston, Jr. Greg Fleischer
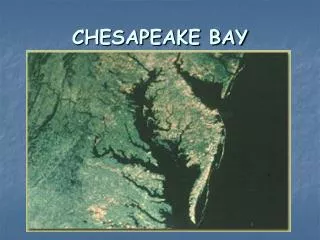
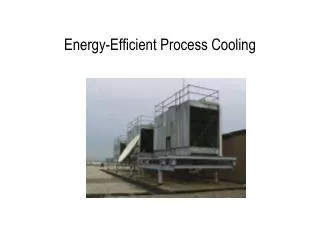
Salem Nuclear Generating Station • Delaware River Estuary (RM 50) • Two Nuclear-Powered Units • Once Through Cooling Systems
Once-Through Cooling System • 12 Intake Bays • Permit to Withdraw– 3.024 Billion GPD • ≈ 1,050,000 GPM or 1% of Tidal Flow • Fish & Aquatic Organisms • Entrained • Impinged • Over 3 Billion Fish Killed Per Year
Table 3-1 1998 PSE&G Loss Estimates *Source: Permit Renewal application NJPDES Permit No. NJ0005622, Public Service Electric & Gas Company Salem Generating Station, March 4, 1999, Appendix L, Tab 8 ** Source: Permit Renewal application NJPDES Permit No. NJ0005622, Public Service Electric & Gas Company Salem Generating Station, March 4, 1999, Appendix L, Tab 9
2001 NJPDES Permit-Special Conditions • Wetland Restoration & Enhancement Program for Delaware Estuary • Installation of Fish Ladders • Baywide Biological Monitoring Program
Purpose of Special Conditions • Enhance the Production of Fish in the Delaware Estuary • Offset Losses of Fish Associated with Entrainment & Impingement at Cooling Water Intake Structure • Presumptions • Marsh Restoration • Phragmites Removal • Reduce Fish Migration Impediments
Instituting Special Conditions • 20,500 Acres of Land Purchased • Wetlands = 12,459 Acres • Diked Salt Hay Farms = 4,398 Acres • Phragmites-dominated Wetlands • 3,723 Acres - NJ • 4,338 Acres - DE • Upland Buffer = 2,649 Acres
Marsh Restoration Methods • Lower Bay Salt Hay Farms • Tidal Inundation • Restore Natural Flows & Vegetative Conditions • Upper BayPhragmites-dominated Marsh • Herbicide Application • Prescribed Burning • Mowing • GOALS: • 95% Phragmites Eradication • Establishment of Mixed Desirable Vegetation
Review & Evaluation of Restoration Project in Increasing Fish Production • Evaluations Based Upon: • PSE&G Documentation of Restoration Efforts • Scientific Literature • Salt Marsh Restoration • Fish Ladders • Visual Observation (Summer)
Review & Evaluation of Restoration Project in Increasing Fish Production • Effectiveness of Wetlands Restoration Methods • Success of Established Plant Community • Plant Densities • Invasion by Phragmites • Fish Utilization
Review & Evaluation of Restoration Project in Increasing Fish Production • Effectiveness of Fish Ladders on River Herring Population • Adult Herring Spawning • Juvenile Herring Development & Emigration
Marsh Restoration Goals • PSEG 12 Year Goals (2008) 76% Spartina Coverage (Desirable Vegetation) 4% Phragmites Coverage • PSEG Interim Goal (2003) 45% Spartina Coverage (Desirable Vegetation)
Lower Bay Marsh Restoration Sites(Salt Hay Farms) • Moores Beach - Reference Site • Commercial Township • Dennis Township • Maurice River Township
Upper Bay Marsh Restoration Sites(Phragmites Dominated Sites) • Mad Horse Creek – Reference Site • Alloway Creek Watershed • Mill Creek • Cohansey River Watershed • Silver Run • Lang Tract • Woodland Beach • The Rocks • Cedar Swamp
Upper Bay Marsh Restoration Sites(Phragmites Dominated Sites)
Marsh Restoration Conclusions • Salt Hay Farm Sites (3 Sites) • Dennis & Maurice Townships • Achieved 12-year Goals for Desired Plant and Phragmites Coverage • Commercial Township • Did Not Reach Interim Goal (45%) for Desired Plant Coverage
Marsh Restoration Conclusions • Phragmites Dominated Sites (8 Sites) • All Sites Reached Interim Goals (45%) • X-Mill Creek • Cohansey, Lang & Woodland Sites • Achieved 12-year Goal for Spartina Coverage • Lang Tract • Achieved 12-year Goal for Phragmites Coverage • Phragmites Reduction – Dependent on Annual Herbicide Treatment
Fish Response at Upper & Lower Bay Restored Marshes • Biological Monitoring Began in 1996 • Annual Reports – Fish Assemblages • Abundance • Size • Species Richness • Study Sites • Uniform • Consistent Sampling Protocols
Fish Response at Lower Bay Salt Hay Farm Sites • Large Marsh Creeks – (1996-2002) • Assemblage & Species Richness • Restored Sites Similar to Reference Sites • Small Marsh Creeks – (1996-2002) • Assemblage & Species Richness • Restored Sites Similar to Reference Sites • Fish Response Has Been Positive
Fish Response at Treated Upper Bay Phragmites Marsh Sites • Large Marsh Creeks – (1996-2002) • Assemblage & Species Richness • Restored Sites Similar to Reference Site • Small Marsh Creeks – (1996-2002) • Assemblage • Differed at all sites • Species Richness
Purpose Eliminate Impediments to Fish Migration Enable Fish to Gradually Climb Dams & Barriers River Herring Alewife Blueback Fish Ladder Installation – 8 Sites Sunset Lake Cooper River Silver Lake McGinnis Pond McColley Pond Coursey’s Pond Garrisons Lake Moores Lake Evaluation of Fish Ladders
Evaluation of Fish Ladders • Evidence of Spawning at all Eight Sites • X-Garrisons Lake • Sites with the Most Stocked Fish Show Limited Fish Ladder Use • Four of the Eight Fish Ladders • Large Numbers of Adult Fish with Limited Stocking • Most Likely Pioneer Fish
Analysis of Baywide Fish Data • Number of Studies Conducted • DNREC • PSE&G • NJDEP • CEA Analysis • DNREC –Juvenile Trawl Data (1991-2001) • Compared Data • 1991-1994 • 1998-2001
Analysis of Baywide Fish Data • Decreases in abundance • Weakfish • White Perch • Spot • Bay Anchovy • Atlantic Silverside • American Shad • Increases in abundance • Blueback Herring • Striped Bass
Report Summary • Marsh Restoration • Lower Bay • Upper bay • Fish Ladders • Stocking Efforts • Spawning Runs • Baywide Fish Data • Overall – No Significant Change in Fish Populations