Download
1 / 9
90 likes | 172 Views
Review of academic data for School-Wide, English Learners, Hispanic/Latino, and Low SES students for goal attainment. Comparison between Term 1 and Term 2 results to track growth and progress towards federal goals.

E N D
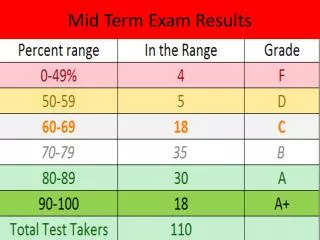
GVC RESULTS TERM 2 2009/2010
The next slide you will see shows where we are at (in green) and where we need to be (in blue) to reach our federal goals… SW: School-Wide EL: English Learners HL: Hispanic or Latino SES: Low SES
MONITORING OUR ELA GOALS • SW: We must increase 9% to reach our goal. • EL: We must increase 7% to reach our goal. • HL: We must increase 11% to reach our goal. • SES: We must increase 13% toreach our goal
The next slides you will see shows where we were at in Term 1 (in red) and where we are at in Term 2 (in green).
Schoolwide ELA GVC ComparisonGrades 2-6 Aggregate (2008: 35% vs. 2009: 41%) DAIT GOAL: 50% We had 16% growth from Term 1 to Term 2
English Learner ELA GVC Comparison Grades 2-6 Aggregate (2008: 29% vs. 2009: 37%) DAIT GOAL 44% 2009/2010 9% increase between Term 1 and Term 2
Hispanic/Latino ELA GVC ComparisonGrades 2-6 Aggregate (2008: 32% vs. 2009: 37%) DAIT GOAL 48% 11% increase between Term 1 and Term 2
Economically DisadvantagedELA GVC ComparisonGrades 2-6 Aggregate (2008: 28% vs. 2009: 36%) DAIT GOAL 49% 14% increase between Term 1 and Term 2
WHAT IS THE DATA TELLING YOU? Please post a comment on the Berry Blog…..