Download
1 / 30
300 likes | 526 Views
FIGURE 10-1 Metabolic steps in the degradation of organic wastes. FIGURE 10-2 Similarly structured compounds having different biodegradability. FIGURE 10-3 Anaerobic reductive dehalogenation of perchloroethene (PCE) to ethene and ethane. FIGURE 10-4

E N D
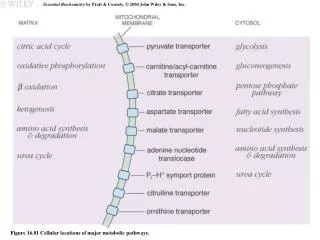
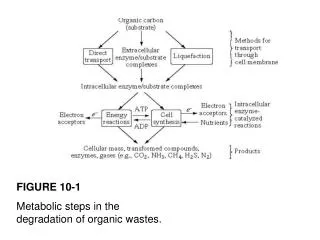
FIGURE 10-1 Metabolic steps in the degradation of organic wastes.
FIGURE 10-2 Similarly structured compounds having different biodegradability.
FIGURE 10-3 Anaerobic reductive dehalogenation of perchloroethene (PCE) to ethene and ethane.
FIGURE 10-4 Mixed culture of three microbial species involved in the anaerobic degradation of chlorobenzoate.
FIGURE 10-5 Effect of temperature on the growth rate of a particular species of mesophilic bacteria.
FIGURE 10-6 Growth of bacteria in batch culture.
FIGURE 10-7 Degradation of organics and corresponding increase in biomass.
FIGURE 10-8 Effect of substrate concentration on bacterial growth rate (hypothetical example).
FIGURE 10-9 Monod half-velocity constant (hypothetical example).
FIGURE 10-10 Effect of toxic inhibition on the bacterial growth rate (hypothetical example).
FIGURE 10-11 Critical concentration (.) for an inhibitory substance.
FIGURE 10-12 Conventional liquid-phase treatment.
FIGURE 10-13 Flow and solids balance for system with recycle.
FIGURE 10-14 Sequencing batch reactor operation.
FIGURE 10-15 Examples of attached growth systems
FIGURE 10-16 Completely mixed, suspended growth treatment system.
FIGURE 10-17 Zimpro PACT TM process.
FIGURE 10-18 Multiple-stage slurry-phase treatment system.
FIGURE 10-19 Distribution of mass of soil and contaminants by soil fraction.
FIGURE 10-20 EIMCO Biolift TM slurry-phase bioreactor.
FIGURE 10-21 Land treatment system and equipment.
FIGURE 10-22 Fate of constituents in land treatment.
FIGURE 10-23 Final oil and grease concentrations at the test plot.
FIGURE 10-24 Composting methods—static piles.
FIGURE 10-25 Composting methods—enclosed reactor.
FIGURE 10-26 Relative electron acceptor concentrations versus distance in a theoretical plume.
FIGURE 10-27 Example plume-monitoring well network.
FIGURE 10-28 Drawing of typical bioventing systems.
FIGURE 10-29 Biosparging system.
FIGURE 10-30 In situ lagoon treatment.