Download
1 / 29
300 likes | 514 Views
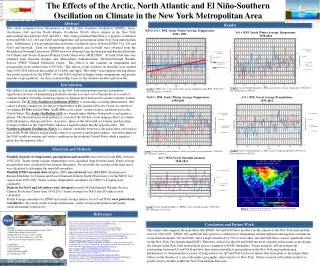
Challenges in Measuring External Current Systems Driven by Solar Wind-Magnetosphere Interaction. Guan Le NASA Goddard Space Flight Center. Introduction.

E N D
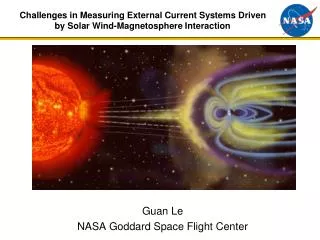
Challenges in Measuring External Current Systems Driven by Solar Wind-Magnetosphere Interaction Guan Le NASA Goddard Space Flight Center
Introduction • In geomagnetism studies, it is always a challenge to separate magnetic fields from external currents originating from the ionosphere and magnetosphere. • The ionospheric and magnetospheric currents are very dynamic and changes on relatively short and varying scales. • The ionospheric and magnetospheric currents are intimately controlled by the ionospheric electrodynamics and the solar wind-magnetosphere-ionosphere coupling.
External Currents Driven by Solar Wind-Magnetosphere-Ionosphere Coupling Magnetospheric Currents: • Magnetopause current • Magnetotail current • Ring current Magnetosphere-Ionosphere coupling: • Field-aligned Currents Ionospheric Currents • Pedersen currents • Hall currents and auroralelectrojets (Credit: SwRI)
Recent Observations Space Technology 5 (ST-5) • Field-aligned currents • Cross-polar cap Pedersen currents Communication/Navigation Outage Forecasting System (C/NOFS) • The ring current
Space Technology 5Mission Overview • Space Technology 5 (ST-5) is a three micro-satellite constellation mission deployed into a low Earth orbit for technology validation. • Mission Duration: 90 days • Launched March 22, 2006 • Mission completed June 21, 2006 • Orbit • Sun-synchronized • Dawn-dusk meridian plane • 300 km Perigee • 4500 km Apogee • 105.6 deg inclination • 136 min orbit period • Constellation Configuration: • String of Pearls • ~ 50 - 5500 km spacing • Science Instruments: Miniature fluxgate magnetometer
Field-Aligned Currents: Separating Space and Time Temporal Variation Spatial Variation
ST5 Trajectories on April 14, 2006 Southern polar cap pass near apogee Northern polar cap pass near perigee
ST5 Observations of Field-Aligned Currents (2006-04-14) UT Alt_094 (km) MLT_094 (Hr) Mlat_094 (deg)
Field-Aligned Currents Motion and Temporal Variations (2006-04-14) Mesoscale ~ 100 km; Large-scale: ~ 1000 km
Ionospheric Closure Currents • To maintain their divergence-free condition, overall downward FACs must eventually balance the overall upward FACs. • There is generally an imbalance in total currents between R1 and R2 FACs (more currents in R1 than in R2). • Most of the current closure takes place via local Pedersen currents within auroral zone flowing between upward and downward FACs; • The net currents due to the R1-R2 imbalance can be closed within R1 via cross-polar cap Pedersen currents. Dawn R1 Dusk R2 R1 R2 Dawn Dusk [Le et al., JGR, 2011]
Closure of Field-aligned Currents in the Ionosphere ST-5 Observations [Le et al., JGR, 2011]
Summary of ST5 Observations • ST5’s multi-point data can be used to separate FACs’ temporal and spatial variations on time scales of ~ 7 – 700 s and spatial scales of ~ 50 - 5500 km. • During active periods, meso-scale current structures are very dynamic. • Highly variable in current density and/or polarity at ~ 10 min time scale • Relatively stable at ~ 1 min time scale • Large-scale currents are relatively stable at ~ 10 min time scales. • ST5 observations show that Region 1 currents are generally stronger than Region 2 currents in both the dawnside and duskside. The imbalance between R1 and R2 currents indicates that: • ~ 95% of FACs are closed by local Pedersen currents flowing equatorward in the dawnside (poleward in the duskside) within the auroral zone between the upward and downward FACs. • ~ 5% of FACs are closed via cross-polar cap Pedersen currents flowing from dawn to dusk. The total amount of the cross-polar cap Pedersen currents is in the order of ~ 0.1 MA. ST5 data are available publicly at the Virtual Magnetospheric Observatory (VMO) at http://vmo.gsfc.nasa.gov/.
Communication/Navigation Outage Forecasting System C/NOFS Mission Overview • C/NOFS was launched into a low inclination, elliptical orbit on April 16, 2008. • Inclination: 13 degrees • Orbit Perigee: 401 km • Orbit Apogee: 867 km • Orbit period: 97 min • C/NOFS provides a complete coverage of all local times every 97 minutes, which allows us to study the temporal and local time variations of the ring current during geomagnetic storms.
Magnetic Field Observations Local Time Variations of Northward Magnetic Residuals • C/NOFS magnetic field data are first calibrated using the latest POMME model. • dBN = BN(C/NOFS) – BN (IGRF) • Presentation of the Data • - Dashed circle: Baseline dBN=0 • - Blue circle: Dst index • - Thick black trace: • dBN data versus the local time • - Red circle: • least square fit of the data • Center of the fitting circle • Radius of the fitting circle
Magnetic Field Observations During the May 29, 2010 Magnetic Storm (1/8)
Magnetic Field Observations During the May 29, 2010 Magnetic Storm (2/8)
Magnetic Field Observations During the May 29, 2010 Magnetic Storm (3/8)
Magnetic Field Observations During the May 29, 2010 Magnetic Storm (4/8)
Magnetic Field Observations During the May 29, 2010 Magnetic Storm (5/8)
Magnetic Field Observations During the May 29, 2010 Magnetic Storm (6/8)
Magnetic Field Observations During the May 29, 2010 Magnetic Storm (7/8)
Magnetic Field Observations During the May 29, 2010 Magnetic Storm (8/8)
Magnetic Field Observations During the May 29, 2010 Magnetic Storm
Provisional Dst Index Estimated from C/NOFS MAG Data The May 29, 2010 Storm
Summary of C/NOFS Observations • C/NOFS measurements consistently show that the magnetic field residuals (and the ring current) is very asymmetric in local time during the main phase of geomagnetic storms. The ring current becomes less asymmetric during the recovery phase, but remains asymmetric in local time. • It is feasible to measure provisional Dst index in real time using magnetic field data from low altitude equatorial satellites.
Conclusions Single spacecraft observations are not able to separate spatial and temporal variations, and thus to accurately describe the configuration of the external current system. A constellation mission with a combination of low and high inclination spacecraft is needed. • A single low inclination spacecraft is able to monitor the temporal evolution and local time distribution of the ring current during magnetic storms. It can also provide near real time provisional Dst index. • Multiple high inclination spacecraft with different orbital configurations are needed to specify high latitude currents. • Two or more spacecraft in the same orbit (string-of-pearl) • Multiple local times • Simultaneous monitoring in the northern and southern polar regions
ST5 Mission and Orbit Profile 224 094 155