Download
1 / 13
130 likes | 252 Views
NENG-Combined Cycle, New Unit Hierarchy, and Growth Rates. Background on NENG-Combined Cycle. Units in CT, MA, ME, NH and RI About 53 existing units Sizes range from 40 MW to 330 MW Total capacity = 10,505 MW Existing unit UF’s range from 0.006 to 0.67, most in upper portion of range

E N D
Background on NENG-Combined Cycle • Units in CT, MA, ME, NH and RI • About 53 existing units • Sizes range from 40 MW to 330 MW • Total capacity = 10,505 MW • Existing unit UF’s range from 0.006 to 0.67, most in upper portion of range • No retirements • Three new state-supplied units, total capacity about 700 MW • One generic unit of 500 MW
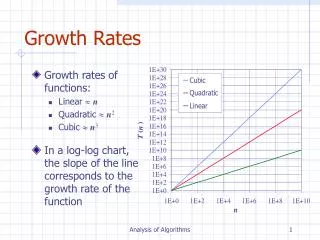
More Background • Hourly hierarchy = 6 hour block • Hour 19 of 8/27/2007 had max generation, so the first 6 hours in the hierarchy are ------------> • Also: • Peak growth rate = 1.36 • Annual growth rate = 0.72 (?) • Transition Hours are 10 and 50 • NonPeak growth rate = 0.7166 Note large difference between Peak and Annual GR!
Trial Changes • New Unit Hierarchy Percentile determines where in the unit hierarchy new units are inserted • The placement determines which unit is the combined cycle mimic unit • Units higher in the hierarchy receive excess generation before units lower in the hierarchy.
What Happens to Mimic Units? • Every hour, the new units are loaded with generation first. • Amount provided is scaled to the amount generated by the mimic unit in the base year • Other existing units operating that hour in the base year may be curtailed or turned off, if the hour’s growth rate is low enough. • Annually, the mimic unit’s total generation is the most affected due to new unit loading
Effects of New Unit Loading on Mimic Units • In Version 1, each new unit was initially loaded at a UF of 0.62; V2 of 0.53; V3 of 0.33. • Existing units that start with a higher utilization fraction continue to have a higher utilization fraction in the FY as compared to other existing units. • Being the mimic unit tends to depress the annual FY UF, as compared to trials where the existing unit is NOT the mimic unit
Comparing Changes to the HSGR and the AFYGR • HSGR=Hour specific growth rate • Not dependent on retirements and new units • If the universe of units for BY and FY were identical, HSGR would equal AFYGR • AFYGR=Adjusted future year growth rate • Changes hourly depending on retired unit generation, new unit generation, base year generation, and HSGR • In any hour, for NENG-combined cycle, the more the new units operate, the bigger the difference between HSGR and AFYGR = (HSGR*base year generation-total new unit generation)/(base year generation – retired base year generation)
V1 Graph of HSGR versus AFYGR 1st 6,000 hrs, mimic heavily utilized in BY, so large difference between HSGR and AFYGR. Last 2,000 hrs, mimic unit was off, so no loading to new units. HSGR=AFYGR
V2 Graph of HSGR versus AFYGR Hrs when mimic unit made up most or all of BY power. New units operate in the FY, but existing units turned off (AFYGR=0)
V3 Graph of HSGR versus AFYGR Note in some instances peak rates are reduced less-existing units will be operating more on peak hours. Much less difference in AFYGR and HSGR due to change in mimic unit.
Food for Thought • Where to set the transition hours? • 10 and 50 are not necessarily demonstrative of anything. • Where to set the new unit hierarchy percentile? • In general, higher is better—want the new units to operate a lot. • Region should be reviewed/understood before deciding. • Limits or caps on relative differences between peak and annual growth rates?