Download
1 / 20
200 likes | 352 Views
Clustering Short Gene Expression Profiles. Ling Wang Marco Ramoni Paolo Sebastiani. The Problem: Input. Gene expression profiles for J genes from microarray experiments. [1]. The Problem: Output. A clustering of the genes that groups functionally related genes in the same cluster.

E N D
Clustering Short Gene Expression Profiles Ling Wang Marco RamoniPaolo Sebastiani Abdullah Mueen
The Problem: Input Gene expression profiles for J genes from microarray experiments [1] Abdullah Mueen
The Problem: Output • A clustering of the genes that groups functionally related genes in the same cluster. Abdullah Mueen
Previous Works • Hierarchical Clustering (Eisen et al., 1998) • K-means and self organizing maps (Tamayo et al, 1999) • Standard measures : Euclidian Distance, Correlation coefficient. • Problem • Ignores the sequential nature of the profiles. • Different pairs of time series can have same measure. [3] Abdullah Mueen
Previous Works • Continuous representation of the profile using • Autoregressive Models. • Hidden Markov Models. • Advantages: • Count the temporal information • Good for long profiles ( 10 points or more ) • Easily go with Bayesian Clustering. [3] Abdullah Mueen
Autoregressive Model: Definition • Each time point is correlated with p previous time points. • Combining the models of all the time points for a gene • Xj is the regression matrix of size (n-p)x(p+1) and βj is the coefficient matrix. [2] Abdullah Mueen
Autoregressive Model: Problems • Problems • AR model is for stationary time series. Interval between time points are ignored. • For short gene expression profiles (5 time points) the regression order can not be large. • For a large number of genes with short expression profiles, there may be random patterns. AR model overfit these random patterns. Abdullah Mueen
The Algorithm The algorithm has three components • A modeldescribing the dynamics of gene expression temporal profiles. • A probabilistic metric to score different clustering models based on the posterior probability of each clustering model. • A heuristic to make the search for the best clustering model feasible. Abdullah Mueen
Polynomial Model: Definition • Each time point is approximated by a polynomial of degree p . • The combined model for a gene is Abdullah Mueen
Polynomial Model: Assumptions • The uncorrelated errors are normally distributed with mean 0 and variance1/τjwhere • The coefficients are normally distributed • β0, α1andα2are hyper-parameters of the prior distributions of the parameters. Abdullah Mueen
Hyper-parameters • Around 25-50% of the total number of genes/probes in the microarrays are disregarded because of their low confidence level. • To avoid overfitting random patterns, hyper parameters are estimated from random data. • If σ2a is the sample variance of the disregarded genes then the hyper-parameters are related through Abdullah Mueen
Scoring Method • The scoring function is calculated using marginal likelihood of each gene which is • For the current model marginal likelihood of a gene is Abdullah Mueen
Marginal Likelihood • With the polynomial model, assumed prior distribution and hyper parameters, the marginal likelihood function is computed. Abdullah Mueen
Scoring the Model • The weighted average of the marginal likelihood of each gene is the scoring function for a clustering model. • The weights for each cluster varies with the size of the cluster. Abdullah Mueen
Agglomerative Clustering • The clustering phase starts with singleton clusters. • It computes and • Iterativelymergestime series into clusters until the scoring function does not increase. • While merging it takes average of the cluster representatives. Abdullah Mueen
Heuristic Search • Computing the scoring function for all the model is expensive and a heuristic is adopted. • Instead of computing all the possible merge pairs, it tries to find a merge pair that increases the scoring function. The search for such a merge pair is done in the descending order of their Euclidian Distance, Dynamic Time Warping, etc. Abdullah Mueen
Evaluation: Simulation Abdullah Mueen
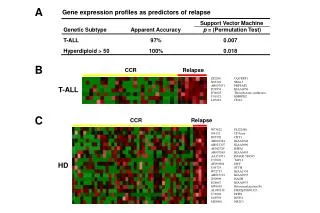
Evaluation: Real Data • The gene expression profiles from [1] are used. Clusters are tested using Gene Ontology enrichment test with EASE (Hosack et al. 2003). Abdullah Mueen
Conclusion • Short gene expression profiles are modeled using polynomials. • A clustering model is evaluated using the marginal likelihood of the genes with respect to the polynomial model. • An agglomerative clustering is done with a heuristic search strategy. • Output clusters are gene ontology enriched. Abdullah Mueen
References • Guillemin K., Salma N.R., Tompkins L.S., and Falkow S. Cag pathogenicity island-specific responses of gastric epithelial cells to Helicobacter pylori infection. PNAS. 99: 15136-15141, 2002. • M. Ramoni, P. Sebastiani, and I. S. Kohane. Cluster analysis of gene expression dynamics. Proc. Natl. Acad. Sci. USA, 99(14):9121–6, 2002 • J. Ernst, G. J. Nau, and Z. Bar-Joseph. Clustering short time series gene expression data. Bioinformatics, 21 Suppl. 1:i159-i168, 2005 Abdullah Mueen