Download
1 / 35
350 likes | 486 Views
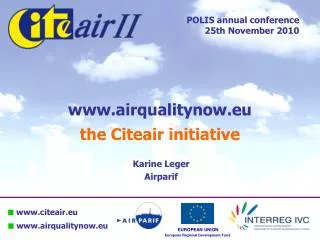
POLIS annual conference 25th November 2010. www.airqualitynow.eu the Citeair initiative. Karine Leger Airparif. Presentation of the CITEAIR project. Project overview. CITEAIR II : Common Information to European Air funded under INTERREG IVc programmes

E N D
POLIS annual conference 25th November 2010 www.airqualitynow.eu the Citeair initiative Karine Leger Airparif
Presentation of the CITEAIR project
Project overview CITEAIR II : Common Information to European Air funded under INTERREG IVc programmes 2nd part of a previous project CITEAIR (INTERREG IIIc) 3 years duration: oct 2008 - sept 2011 11 partners from 8 Member States
Partners Technical organizations (local, regional or national), municipalities and Networks AIRPARIF - air quality monitoring agency – Ile-de-France region and Paris area- (France) DCMR - Environment Protection Agency Rijnmond (NL) Rome Mobilty Agency - (Italie) ARMAAG - Agency of Regional Air Quality Monitoring in the Gdańsk metropolitan area- (PL) EGMASA- environmental agency of Andalusia (Spain) INERIS – French National Institute of Industrial environment and risks CHMI - Czech Hydrometeorological Institute Municipality ofMaribor- Slovenia URM- City Development Authority of Prague REC - Regional Environmental Center for Central and Eastern Europe- Office of Slovenia Polis - network of EU cities and regions for innovative technologies and policies for local transport- Brussels
4 points of note : EU Cities and regions are all facing exposure to high air pollution and emerging impacts of climate change, mobility plays an important role in those issues all share the challenge to develop and implement reduction plans Wealth of knowledge and good practices already available Each other experiences offers ample opportunities for collaboration Need for simple, up to date and comparableinformation for the public Bottom up approach needed: an initiative from the cities and the local agencies dealing with air pollution for themselves Goals and general principles
Goals and general principles Method Identification of good practices : literature, partners’ expertise, workshops and working groups … Taking into account the different tools and level of expertise available Tests and implementation by one or several partners and display on the common website Feedbacks from the users community Elaboration of a guidebook enabling the transferability of those good practices
Results expected Tools to be developed sustainable mobility indicator - describes the mobility status for a city, based on traffic measurements • - links it with the traffic environmental impacts (air pollution, Greenhouse gases) Integrated emission inventories for air pollutants and Greenhouse Gases in order to identify suitable reduction measures and synergies for both issues (avoid antagonist measures!) • Forecasted air quality indices : background + traffic - 3 different methodology depending on the skills and tools available • - cities already having a forecast : possibility to deliver the results too Integration of PM2.5 in the common air quality indices according the CAFÉ directive – 2008
Results expected • Continuation of the common websitewww.airqualitynow.eu • New cities and larger community users, • Translations: better access and diffusion to the public and the media, • New media partnerships to display the common air quality indices • Integration of results from the project developments: - emission inventory for air pollutants and GHGs • - forecasted air quality indices • - mobility indicator - Integration of PM2.5 in the calculation of the common air quality index
Development of European common air quality indices: Origin of the project
European context Public information: EU requirement: EU directives and Aarhus convention needed for local policies Dissemination of modelled or monitored air quality data : • mostlyon theinternet • most widespread way: index ranging from good to bad Information available for air qualityexperts : Ozone Web (see Ozone Web, ozone.eionet.eu.int) AirBase (see airbase.eionet.eu.int) But comparisons are difficult to make for the public
European context EG: air quality comparison in6 CITEAIR cities Rome, Rotterdam, Prague, Seville, Maribor and Paris Youneed to search at least 6 websites but 1st to identify the right body in charge of air quality monitoring : The national or regional government? The municipality? Its traffic, environment or health department? An environmental body or an NGO? You will then be faced with 6 completely different indices Or air quality presentation Thus assuming that you understand 6 languages !! almost impossible for the general public
European context A common AQI did not exist at the European scale Despite EU common regulations Different AQI even sometimesinside of a same country • CITEAIR’s proposed common EU indices and a joined website to display them • A bottom up initiative : coming from cities themselves On a voluntary basis
Citeair’s common air quality indices
Specificity A compromise between a number of objectives Based on an agreement among the partners at first Made for communication purposes The general public is the main target group Need for a dynamic index to entice repeated visits with - hourly updates for the current day - class borders chosen to allow for changing pollutants Must be scientifically rigorous enough Statistical tests, peer review… Must be linked with the EU regulation Must be easy to join for any city safe through an ftp area and automated calculations
Two different indices Representative of 2 types of exposure and pollutants of main concern An urban background index Representative of the average background situation of the city Main pollutants (data mandatory): PM10, NO2 and O3 Additional pollutants (only if data available): SO2 A traffic index Showing typical roadside situation in the city Main pollutants: PM10, NO2 Additional pollutants: CO
Pollutants taken into account The need for “additional” pollutants Will hardly make the index in most of the CITEAIR’s cities EU regulations (even alert threshold for SO2) Health effects (but at higher levels) CO : traffic and heating indicator SO2: indicator for diesel traffic and industrial activities In cities with industrial pollution or a seaport, SO2 might occasionally play a role
3 time scales • Anhourly indexfor today (D) Calculated every hours Only concerns the cities able to provide hourly values but of MAJOR INTEREST for the public (+ authorities, media) Adaily indexfor yesterday (D-1) Based on maximum hourly concentrations of the past day Calculated once a day Displayed at D on the CITEAIR common website Concerns most cities taking part in this website The worst sub index makes the index of the day
3 time scales Anannual index • to better take into account long term exposure • based on EU annual limit value / target values, • concerns all cities taking part in this website • presented as a distance to target index where target is derived from the directives
www.airqualitynow.eu Information available and comparisons made possible
Main objectives Providing information linked to people’s preoccupations: “What is the air quality where I am living compared to where I am traveling?” Exposure caused by the traffic vs background conditions An information related as much as possible to EU limit values and alert thresholds : main concern for sensitive people Long term exposure taken into account through an annual index
Current state Currently 91 participating cities • Thank you to all of them for trusting us, especially • Gdansk, Sopot, Gdynia, Tczew • Half of the cities • above 1 million inhabitants • 4/5 of the biggest EU cities • available in 9 languages
Background vs traffic Today (hourly update) vs yesterday Comparisons possible 2 types of exposure: Different time scales:
Background vs traffic Annual index Different time scales: Today vs yesterday on an annual basis (annual index since 2003 for some cities) 2 types of exposure:
for today and yesterday • about its annual situation Detailed information for each city
Detailed information for each city City information page : air quality issues with a comparable format background information (geography) environmental situation towards air quality air quality improvements (action plans implemented) related links Link with the local AQ network : http://www.airqualitynow.eu/about_participating_cities.php
Further developments and other uses
Number of visits x24 Number of pages seen x38 Audience
Developments going on Update of the website: Additional cities still joining in 9Translations yet available, at least 1 more under progress (German …) Further partnerships with themedia : Already 5, mainly websites and media related to environmental issues but further partnerships are linked with the forecast developments
Organisation of the information flow 1- local authorities, user community News 2- Public, media: meant to send them to the website - Public, media - local authorities, user community: For their own website Mobilephones 1- Public, media 2- local authorities, user community Mini website+ application
Other users Partnerships with the Media
Mapped indices (Paris & Ile-de-France area) Other users Undergoing discussions in MS about updating their index: Prague, France … Hot air balloon – Paris
Other users EEA’s Eye on Earth
Use in case of pollution episode Permanent illustration for the public and the media of the air quality observed in the cities Large particle episode in Europe the 11/01/10 Rather « good » situation 10/11/10 at 14:00 pm
Conclusion • Value added and attractiveness • of a common index and its supporting website • A simple, comparable and up to date AQ information • CITIES BASED INFORMATION • from the cities, for the cities • for the pollutants of main concern • inspired by EU regulations • easy to consult • - international platform • - common presentation • •in addition to local information • •but not for compliance checking
Thank you for your attention More information on air quality in EU cities and how to join: www.airqualitynow.eu on CITEAIR II: www.citeair.eu on INTERREG IVC : www.interreg4c.eu Karine leger–Airparif – Deputy Director karine.leger@airparif.asso.fr