Section 1.2 - Finding Limits Graphically and Numerically
Section 1.2 - Finding Limits Graphically and Numerically. Limit. Informal Definition: If f ( x ) becomes arbitrarily close to a single REAL number L as x approaches c from either side, the limit of f ( x ) , as x appraches c , is L. f ( x ). L. x. c. The limit of f(x)….


Section 1.2 - Finding Limits Graphically and Numerically
E N D
Presentation Transcript
Limit Informal Definition: If f(x) becomes arbitrarily close to a single REAL number L as x approaches c from either side, the limit of f(x), as x appraches c, is L. f(x) L x c The limit of f(x)… is L. Notation: as x approaches c…
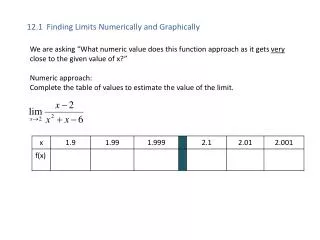
Calculating Limits Our book focuses on three ways: Numerical Approach – Construct a table of values Graphical Approach – Draw a graph Analytic Approach – Use Algebra or calculus This Lesson Next Lesson
Example 1 Use the graph and complete the table to find the limit (if it exists). 6.859 7.88 7.988 8 8.012 8.12 9.261 If the function is continuous at the value of x, the limit is easy to calculate.
Example 2 Use the graph and complete the table to find the limit (if it exists). Can’t divide by 0 -2.1 -2.01 -2.001 DNE -1.999 -1.99 -1.9 If the function is not continuous at the value of x, a graph and table can be very useful.
Example 3 Use the graph and complete the table to find the limit (if it exists). -6 2.9 2.99 -6 2.999 8 2.999 2.99 2.9 If the function is not continuous at the value of x, the important thing is what the output gets closer to as x approaches the value. The limit does not change if the value at -4 changes.
Three Limits that Fail to Exist f(x)approaches a different number from the right side of c than it approaches from the left side.
Three Limits that Fail to Exist f(x)increases or decreases without bound as x approaches c.
Three Limits that Fail to Exist f(x)oscillates between two fixed values as x approaches c. Closest Closer Close
A Limit that DOES Exist If the domain is restricted (not infinite), the limit off(x)exists as x approaches an endpoint of the domain.
Example 1 Given the function t defined by the graph, find the limits at right.
Example 2 Sketch a graph of the function with the following characteristics: • does not exist, Domain: [-2,3), and Range: (1,5) • does not exist, Domain: (-∞,-4)U(-4,∞), and Range: (-∞,∞)
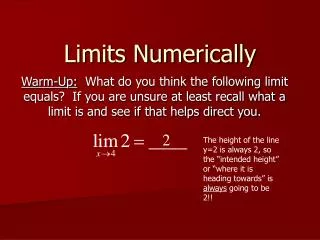
Classwork Sketch a graph and complete the table to find the limit (if it exists). 2.8680 2.732 2.7196 DNE 2.7169 2.7048 2.5937 This a very important value that we will investigate more in Chapter 5. It deals with natural logs. Why is there a lot of “noise” over here?