Understanding Limits: Evaluating Function Behavior Near Points of Discontinuity
This guide explores how to find limits of functions as they approach specific points, particularly near discontinuities. It discusses numerical methods for estimating limits using x-value sets from both left and right sides of a point, defining when a limit exists. Through graphical interpretation, it explains how to analyze function behavior at various x-values. Key scenarios illustrating limits that do not exist (DNE) are examined, including cases of oscillation and unbounded behavior, providing clear examples for effective understanding.


Understanding Limits: Evaluating Function Behavior Near Points of Discontinuity
E N D
Presentation Transcript
Limits described • Goal: To see how a function behaves near a point (such as a discontinuity) use 2 sets of x-values that approach from the left and the right of that point • Definition: if f(x) approaches a #, L, as x approaches c from either side, the limit of f(x) as x approaches c is L.
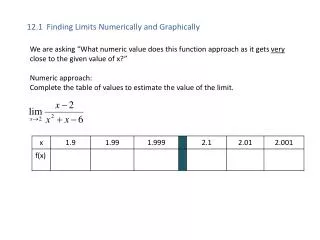
Numerical estimation • Estimate the limit numerically by completing the table for
Answer • Limit is L=1 because y-values on both sides of x=2 approach y=1
Graphical interpretation • Determine the limits at x=1, 2, 3, and 4 given the graph • Remember limits occur at and when the y-values are the same as both sides of the c (x-values) approach c; otherwise L=DNE (does not exist)
Answer • The limits for the various c values: • C=1: L=1 (both sides approach y=1 despite point at y=2) • C=2: L=DNE (left is at y=2 and right is at y=3) • C=3: L=1 (both sides approach y=1) • C=4: L=2 (both sides approach y=2)
Show DNE • Show limit DNE for • Make a table or graph.
Answer • Left L=-1 and right L=1 • -1≠1 so L=DNE • Typical of step functions
Show DNE • Show limit DNE for • Make a table or graph.
Answer • Both sides approach positive infinity which is not a #; therefore, L=DNE • Typical of rational functions
Show DNE • Show limit DNE for • Make a table or graph.
Answer • F(x) oscillates between -1 and 1 so L=DNE • Typical of odd functions
Common behavior associated with DNE limits • F(x) approaches different # from right of c than approaches from left of c. • F(x) increases or decreases without bound as x approaches c. • F(x) oscillates between 2 fixed values as x approaches c.