
Collapsing Bubbles
E N D
Presentation Transcript
Collapsing Bubbles Rachel Rachel Bauer Jenna Bratz
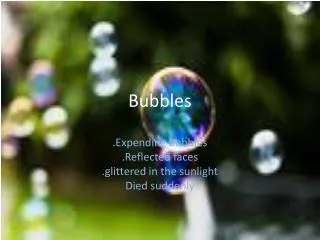
Introduction • Bubbles have been entertaining children for centuries. • Children blew bubbles through clay pipes back in the 1700’s. • Today over 200 million bottles of bubbles are sold each year! • Although fun, there is a direct mathematical reason for which they appear—soap films seek to minimize their surface energy, which means minimizing surface area, making it a sphere.
Procedure • We suspended a tube off of a lab stand. • Grid paper (1cm blocks) was set up behind the tube. • Three different tubes were used--a capillary tube, a straw and a large plastic tube • Rachel dabbed the soap solution onto the tube and blew a bubble and Jenna started and stopped the high speed camera to capture the collapse of the bubble. • The camera took 60 frames per second.
Procedure (cont.) • The videos were stored as a sequence of pictures. • Pictures were put into Matlab and a program was used to find the least squares circle to fit the data points around the bubble • The average radius was then calculated
Data Straw Trial 3: Initial Bubble After .45 sec After .7 sec After .85 sec
Theory • We want to begin modeling the deflation of a soap bubble through a narrow tube. • By Poiseuille’s equation we know that the change in the gas volume with respect to time is given by , where r is the radius, l is the length of the tube, is the viscosity of the air, and is the change in pressure.
Theory (cont.) • The equation for the change in volume of the bubble is also given by where R is the radius of the bubble. • By the Laplace-Young Law we have since there are two surfaces of the bubble. • Setting the two equations equal and separating variables we get the following equation with initial condition .
Theory (cont.) • Solving this differential equation we find • The radius was then calculated using a Matlab program that takes points around bubble and finds the least squares circle to fit those points. (Thanks Derek!) • Next we wanted to calculate the surface tension for each of the trials.
Analysis • We want to compare the actual radius we found for our data with the expected radius given by the theory. • Find the least squares curve that approximates our data points. R t
Analysis (cont.) • Minimize the error between the square of the sum of the expected (theoretical) radii and the actual radii: , where and n is the number of data points we have. • Differentiating E with respect to we have:
Analysis (cont.) • We want to find when is equal to 0. • We plotted the functions for each trial in Maple and found the x-intercept. • This is the that minimizes the error. • Capillary Tube: • Trial 1: = .0198 N/m = 19.8 dynes/cm • Trial 2: = .0225 N/m = 22.5 dynes/cm • Trial 3: = .022 N/m = 22 dynes/cm
Analysis (cont.) • Plastic Tube • Trial 1: = .00625 N/m = 6.25 dynes/cm • Straw • Trial 1: = .01335 N/m = 13.35 dynes/cm • Trial 2: = .01316 N/m = 13.16 dynes/cm • Trial 3: = .0141 N/m = 14.1 dynes/cm • Consistent within the same tube, inconsistent for different size tubes. • Straw trials seems to be the best, closest to expected value (13-14 dynes/cm).
Two Bubble Theory • Extend the model to one with two bubbles, one at each end of the tube: • Analysis will begin the same as above. We now just have two bubbles with volumes V1 and V2.
Two Bubbles (cont.) • The change in the gas volume is: • The change in the volume of the two bubbles is:
Two Bubbles (cont.) • The change in pressure will change. • We have . • Using the Laplace-Young Law we find • Similar to before, set the two equations for dV1 and dV2 equal and plug in the equations for the change in pressure.
Two Bubbles (cont.) • Find two coupled nonlinear first order differential equations: • The total volume in this system is and therefore, so our system has a conservation law—the volume is a constant.
Two Bubbles (cont.) • Phase Plane analysis of system of equations: • Steady-state occurs when R1 = R2. • R1 > R2 : • R1 < R2 :
Two Bubbles (cont.) • Directional Field x=R1, y=R2
Two Bubbles (cont.) • Since the volume is a constant, the equation gives the equation for the trajectories in the phase plane: x=R1, y=R2
Spherical Cap • Note as one bubble gets smaller, the shape changes from a sphere to a spherical cap. • We can modify our model to take this into account. • Assume that R1 > R2, then R1 will increase and R2 will decrease as described above. • Find equations that model the time after R2 equals the radius of the tube.
Spherical Cap (cont.) • The equation for R1 will stay the same, since the shape stays spherical. • The volume of the spherical cap is therefore the change in volume of the cap is given by
Spherical Cap (cont.) • We get the following system of equations: • This system also has a conservation of volume law. , so we have
Spherical Cap (cont.) • The volume is constant, so the equation gives the equation for a trajectory in the phase plane of this system. a = R1, b = R2
Spherical Cap (cont.) • We can plot both phase planes and both trajectories to see the difference after R2 equals the radius of the tube. • We start with R1 > R2, R1 will increase along the black trajectory until it reaches the point where R2 is equal to the radius of the tube, then R1 will follow the green trajectory and will not increase as much as it would have if it followed the original trajectory. x=R1, y=R2
Conclusion • In general, our surface tension was not consistent throughout our different trials. Possible reasons for error: • Air hitting the bubble • Bubble not remaining steady • Measurement error
Conclusion (cont.) • In the two bubble case, the theory matched small experimental results from class. • Future work: • More experiments to find additional surface tension values. • Extend two bubble case to n bubbles • Attempt to isolate bubble from any disturbances in the lab • Complete experiments to further verify two bubble case