1 / 1

3000 2500 2000 1500 1000 500 0 -500

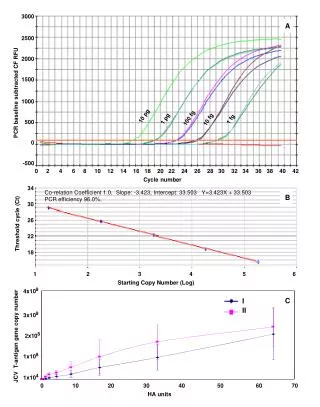
3000 2500 2000 1500 1000 500 0 -500. A. PCR baseline subtracted CF RFU. 10 pg. 100 fg. 1 pg. 1 fg. 10 fg. 0 2 4 6 8 10 12 14 16 18 20 22 24 26 28 30 32 34 36 38 40 42. Cycle number. 34 30 26 22 18.

clare-britt
Download Presentation

3000 2500 2000 1500 1000 500 0 -500

An Image/Link below is provided (as is) to download presentation Download Policy: Content on the Website is provided to you AS IS for your information and personal use and may not be sold / licensed / shared on other websites without getting consent from its author. Content is provided to you AS IS for your information and personal use only. Download presentation by click this link. While downloading, if for some reason you are not able to download a presentation, the publisher may have deleted the file from their server. During download, if you can't get a presentation, the file might be deleted by the publisher.

E N D

Presentation Transcript


  1. 3000 2500 2000 1500 1000 500 0 -500 A PCR baseline subtracted CF RFU 10 pg 100 fg 1 pg 1 fg 10 fg 0 2 4 6 8 10 12 14 16 18 20 22 24 26 28 30 32 34 36 38 40 42 Cycle number 34 30 26 22 18 Co-relation Coefficient 1.0, Slope: -3.423, Intercept: 33.503 Y=3.423X + 33.503 PCR efficiency 96.0%, B Threshold cycle (Ct) 1 2 3 4 5 6 Starting Copy Number (Log) 4x10⁸ 3x10⁸ 2x10⁸ 1x10⁸ 1x10⁴ I II C JCV T-antigen gene copy number 0 10 20 30 40 50 60 70 HA units

More Related