Download
1 / 19
190 likes | 400 Views
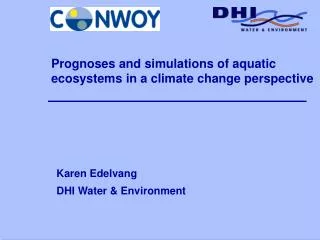
Prognoses and simulations of aquatic ecosystems in a climate change perspective. Karen Edelvang DHI Water & Environment. Objectives. Produce hindcast and nowcast simulations to describe past and present conditions in different aquatic ecosystems with regard to climate effects

E N D
Prognoses and simulations of aquatic ecosystems in a climate change perspective Karen Edelvang DHI Water & Environment
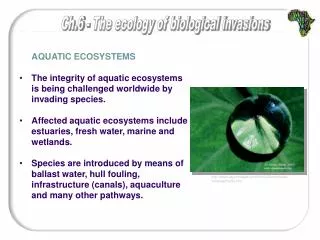
Objectives • Produce hindcast and nowcast simulations to describe past and present conditions in different aquatic ecosystems with regard to climate effects • Produce forecast simulations and prognoses for the effect of climate change on different aquatic ecosystems • Assess climate change impacts on a longer time scale in order to identify possible future management strategies and needs
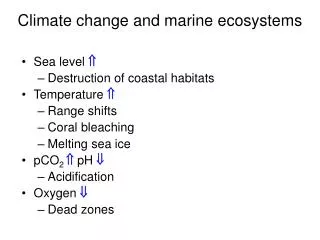
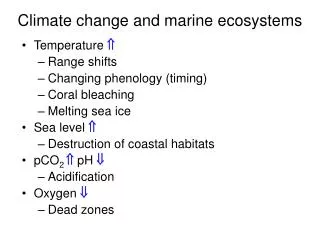
Hydrography • Sea level rise • Changes in fresh water run-off • Coastline replacement • New shallow coastal areas • Haloclines • Thermoclines • Salinity intrusions to the Baltic • Salinity changes in the coastal zone • Fluxes through the Danish straits • Extreme events
Sedimentology • Changes in suspended sediment supply • Changes in dissolved/particulate nutrients • Coastline replacement • Increased precipitation - increased erosion - changes in water fluxes to the sea • Changes in morphology in basin/delta/coast
Biology • Changes in primary production • Changes in nutrient supply • High impact zone= coastal zone • Salinity intrusions to the Baltic • New shallow coastal areas • Location of haloclines • Location of thermoclines • Extreme events
Scenarios with the Water Forecast 1 Nowcast: Calibrated with in situ measurements. Reference year = 2000 2 Hindcast: Validated against developed rating curves etc. 3 Forecast: Produce forecast simulations and prognoses for the effect of climate change on different aquatic ecosystems
Vandudsigten Salinity at Ven (St. 431) 2000: Measured VS modelled
Vandudsigten • Cross project activities • Detailed modelling of stratification at selected locations: • - Kattegat • - Dogger Banke • - Baltic Sea • Sea surface temperature comparisons with meteorological fields • Fish habitat distribution
Satellite images of chl-a Satellite images from 2000: Chl-a for validation of new blue-green algae module to MIKE 3
New blue-green algae module • 10 algae components: • -flagellates (C, N, P) • -diatoms (C, N, P, Si) • -blue-green (C, N, P) • Chlorophyll • Zooplankton • 4 inorganic nutrients (C, N, P, Si) • NH+4 & NO -3 • Inorganic silicate • H2S • Inorganic P • Oxygen • Changes in nutrient supply • New shallow coastal areas • Location of haloclines • Location of thermoclines • Salinity intrusions to the Baltic • High impact zone= coastal zone • Extreme events
Odense Fjord Water level at Sæden Strand
Odense Fjord Water level at Sæden Strand: Reference VS 0.5 m increase
Meteorology • Reference year = 2000 • Climate model scenario with measurements used as boundary conditions • Re-calibration of the water forecast in response to the climate model • Alternative: transform statistics from climate model output to real measurements • Inter-calibration of climate model to water forecast
Comparison between simulated chl-variation and SeaWiFS image 28 March 1999
Comparison between simulated chl-variation and SeaWiFS image 6 May 1999
Effect of 50% increase of the discharge from Danish rivers Inorganic nitrogen January-February Primary production March-September
Percentage increase in primary production: The effect of a general increase in water surface temperature of 2.5C in summer
Forecast of total change in primary production March-September 12 11 10 Prim. prod. [mio. ton C] 9 . 8 Reference Precipitation Temperature UVB