Bone Mineral Density Testing in Clinical Practice
450 likes | 1.24k Views
Bone Mineral Density Testing in Clinical Practice. Screen & Intervene Critical Challenges in Osteoporosis and Women’s Health. Outline. Background Diagnosis of osteoporosis BMD and fracture risk Indications for BMD testing Interpretation of BMD tests

Bone Mineral Density Testing in Clinical Practice
E N D
Presentation Transcript
Bone Mineral Density Testing in Clinical Practice Screen & Intervene Critical Challenges in Osteoporosis and Women’s Health
Outline • Background • Diagnosis of osteoporosis • BMD and fracture risk • Indications for BMD testing • Interpretation of BMD tests • Combining BMD and clinical risk factors • Selecting patients for treatment • Serial BMD testing • Peripheral bone density testing
Osteoporosis is a Silent Disease • No symptoms • No findings on physical exam • No laboratory abnormalities • Increase in fracture risk • Fractures have serious consequences • Treatment can reduce fracture risk Challenge: To identify and treat patients at risk for fracture before the first fracture occurs
Increased risk of future fractures Chronic pain Surgery Loss of height Impaired pulmonary function Abdominal symptoms Medical expenses / lost income Hospitalization Surgery Rehab hospital Nursing home Loss of self-esteem Depression Loss of independence Disability Death Consequences of Fractures
Relative Risk of Death Following Clinical Fractures Any Symptomatic Nonspine 6.7 Hip 8.6 Spine Forearm Other 0.3 1.0 2.0 5.0 10.0 16.0 Fracture Intervention Trial (FIT): 6459 postmenopausal women aged 55-81 years followed for an average of 3.8 years Age-Adjusted Relative Risk (95% CI) Cauley JA et al. Osteoporos Int. 2000;11:556-561.
Diagnosis of Osteoporosis • Densitometric Diagnosis • Dual-energy X-ray absorptiometry (DXA) • World Health Organization (WHO) criteria • Clinical Diagnosis • Fragility fracture
WHO Classification of BMD WHO Study Group 1994.
Use Clinical Judgment • T-score greater than -2.5 does not eliminate the possibility of osteoporosis • Clinical diagnosis of osteoporosis may be made in the presence of a fragility fracture • T-score -2.5 or less does not always mean that osteoporosis is present • Primary disease may be something else (e.g., osteomalacia, multiple myeloma)
DXA is the “Gold Standard” • Widely used in epidemiological studies from which prevalence data is derived • WHO criteria based on BMD measured by DXA • Correlation with fracture risk • Low radiation • Excellent precision
Clinical Uses of DXA • Diagnose osteoporosis • Predict fracture risk • Monitor changes in BMD
Indications for BMD Testing Official Position • Screening • Women aged 65 and older. • Men aged 70 and older. • Risk Factors • Postmenopausal women under age 65 with risk factors. • Adults with a fragility fracture. • Adults with a disease or condition associated with low bone mass or bone loss. • Adults taking medications associated with low bone mass or bone loss. • Treatment • Anyone being considered for pharmacologic therapy. • Anyone being treated, to monitor treatment effect. • Anyone not receiving therapy in whom evidence of bone loss would lead to treatment. Women discontinuing estrogen should be considered for bone density testing according to the indications listed above.
Bone Mass Measurement Act, 7/1/98 Five Categories of Medicare Covered Services • Estrogen-deficient women at clinical risk for osteoporosis • Individuals with vertebral abnormalities • Individuals receiving long-term glucocorticoid therapy • Individuals with primary hyperparathyroidism • Individuals being monitored to assess the response to or efficacy of an FDA-approved osteoporosis drug therapy Federal Register, Volume 63, Number 121, June 24, 1998.
Diagnosis in Postmenopausal Women and in Men Age 50 and Older Official Position • Osteoporosis may be diagnosed in postmenopausal women and in men age 50 and older if the T-score of the lumbar spine, total hip or femoral neck is -2.5 or less:* • In certain circumstances the 33% radius (also called 1/3 radius) may be utilized. *Note: Other hip regions of interest, including Ward’s area and the greater trochanter, should not be used for diagnosis. Application of recommendation may vary according to local requirements.
Diagnosis in Premenopausal Women and Men Younger than Age 50 Official Position • Z-scores, not T-scores are preferred. This is particularly important in children. • A Z-score of -2.0 or lower is defined as “below the expected range for age” and a Z-score above -2.0 is “within the expected range for age.”
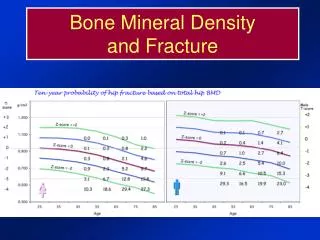
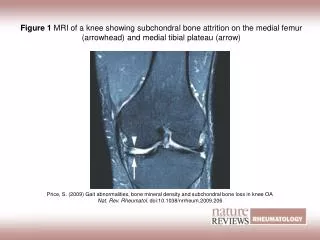
Bone Density and Fracture Risk Relative Risk for Fracture Bone Density (T-score) Adapted from Faulkner KG. J Bone Miner Res. 2000;15:183-187.
Age is an Independent Risk Factor for Fracture Age 80 70 60 Ten Year Fracture Probability (%) 50 Probability of first fracture of hip, distal forearm, proximal humerus, and symptomatic vertebral fracture in women of Malmö, Sweden. Adapted from Kanis JA et al. Osteoporosis Int. 2001;12:989-995.
Predicting Hip Fractures: Relative Risk vs. Fracture Probability Relative Risk = (RR per SD)T-score or Z-score Difference 10-Year Probability from Swedish National Bureau of Statistics *Postmenopausal Woman (a) Marshall D et al. BMJ. 1996;32:1254-1259.(b) Kanis JA et al. Osteoporos Int. 2001;12:417-427.
Prior Fracture Increases Relative Risk of Subsequent Fractures Klotzbuecher CM et al. J Bone Miner Res. 2000;15:721-739.
BMD and Clinical Risk Factors Predict Hip Fractures Risk Factors Age ≥ 80 Family Hx Hip Fx Any Fx Except Hip Since Age 50 Fair, Poor or Very Poor Health Hx Hyperthyroidism Anticonvulsant Therapy Current Benzodiazepine Rx Current Weight < Age 25 Weight Caffeine > 2 Cups Coffee per Day On Feet ≤ 4 hours per Day No Walking for Exercise Can’t Rise From Chair Without Using Arms Lowest Quartile Depth Perception Lowest Quartile Contrast Sensitivity Heart Rate > 80 Rate of Hip Fracture (per 1000 woman-years) No. of Risk Factors Calcaneal Bone Density SOF in 9516 white women over age 65 with no previous hip fracture Cummings SR et al. N Engl J Med. 1995;332:767-773.
NOF Treatment Guidelines Initiate therapy to reduce fracture risk in women with • T-Score less than -2.0, regardless of risk factors† • T-score between -1.5 and -2.0, if at least one risk factor is present • Previous vertebral or hip fracture †Major risk factors = fracture as an adult, first degree relative with fragility fracture, weight less than 127 lbs., current smoking, glucocorticoid therapy more than 3 mo. Physician’s Guide to Prevention and Treatment of Osteoporosis. National Osteoporosis Foundation. 2003.
Most Fractures Occur in Patients with T-score Greater Than -2.5 • Study of Osteoporotic Fractures (SOF) • 8,065 postmenopausal women age 65 or older • 54% of women with hip fracture had baseline T-scores greater than -2.5 (total hip) • National Osteoporosis Risk Assessment (NORA) • 149,524 postmenopausal women with mean age of 65 • 82% of 2,259 women with fragility fractures had baseline T-scores greater than -2.5 (peripheral) Wainwright SA et al. J Clin Endocrinol Metab. 2005;90:2787-2793. Siris ES et al. Arch Intern Med. 2004;164:1108-1112.
WHO Project • Goal: To develop a standardized methodology for expressing fracture risk and intervention thresholds for men and women worldwide • Method: Study correlations of BMD and clinical risk factors with fracture outcomes in large prospective observational studies, and apply cost utility analysis to set intervention thresholds
Fracture Risk Reporting • Since the goal of osteoporosis therapy is fracture prevention, patient selection is best based on fracture risk • T-score alone does not provide a complete assessment of fracture risk • Combination of clinical risk factors with BMD may provide a better way of identifying patients for treatment
Selection of Clinical Risk Factors • Independent of BMD (if BMD is known) • Validated in multiple populations (sex, ethnicity, country) • Easily obtainable • Amenable to intended treatment • Intuitive Adapted from Kanis JA et al. Osteoporos Int. 2005;16:581-589.
Clinical Risk Factors Femoral neck T-score + • Age • Previous low trauma fracture • Current cigarette smoking • Rheumatoid arthritis • High alcohol intake (> 2 units/day) • Parental history of hip fracture • Prior or current glucocorticoid use Adapted from Kanis JA et al. Osteoporos Int. 2005;16:581-589.
Intervention Threshold • A fracture probability above which it is cost-effective to treat with pharmacological agents • Based on statistical modeling using many medical, social, and economic assumptions
Decision to Treat • Fracture probability • Cost-effectiveness • Efficacy • Safety • Expected adherence to therapy • Non-skeletal risks and benefits • Patient beliefs and preferences
Why do serial BMD testing? • To monitor response to therapy by finding an increase or stability of bone density, and • To evaluate for non-response by finding loss of bone density- suggesting the need for re-evaluation of treatment and evaluation for secondary causes of osteoporosis J Clin Densitom. 2002;5(Suppl):S1-S45.
When should repeat BMD testing be done? • When expected change in BMD equals or exceeds the “Least Significant Change” (LSC) • Intervals between BMD testing should be determined according to each patient’s clinical status • Consider 1 year after initiation or change of therapy • Longer intervals once therapeutic effect is established • Shorter intervals when rapid bone loss is expected J Clin Densitom. 2002;5(Suppl):S1-S45.
Always Compare BMD Never Compare T-scores
BMD Values from Different Manufacturers are Not Comparable • Different dual energy methods • Different calibration • Different detectors • Different edge detection software • Different regions of interest
Vertebral Fracture Assessment (VFA) Normal Vertebral Fx Recognition of vertebral fracture may • Change diagnostic classification • Change estimate of fracture risk • Change treatment decisions
Peripheral Bone Density Measurement • Good prediction of fracture risk • Good tool for skeletal health education • Cannot be used with the WHO criteria for diagnosis of osteoporosis • Not useful for monitoring bone density changes J Clin Densitom. 2002;5(Suppl):S1-S45.
Summary • BMD testing can diagnose osteoporosis, predict fracture risk, and monitor changes in BMD over time • Combination of BMD and clinical risk factors is as better predictor of fracture risk than BMD or clinical risk factors alone • Patients at high risk for fracture are most likely to benefit from therapy