Download
1 / 4

E N D
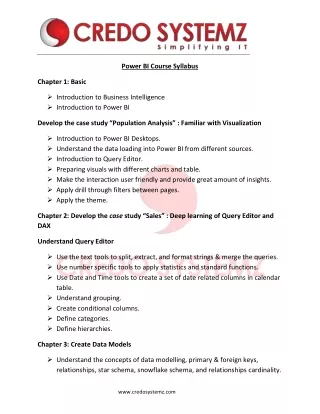
Power BI Course Syllabus Chapter 1: Basic ➢Introduction to Business Intelligence ➢Introduction to Power BI Develop the case study “Population Analysis” : Familiar with Visualization ➢Introduction to Power BI Desktops. ➢Understand the data loading into Power BI from different sources. ➢Introduction to Query Editor. ➢Preparing visuals with different charts and table. ➢Make the interaction user friendly and provide great amount of insights. ➢Apply drill through filters between pages. ➢Apply the theme. Chapter 2: Develop the casestudy “Sales” : Deep learning of Query Editor and DAX Understand Query Editor ➢Use the text tools to split, extract, and format strings & merge the queries. ➢Use number specific tools to apply statistics and standard functions. ➢Use Date and Time tools to create a set of date related columns in calendar table. ➢Understand grouping. ➢Create conditional columns. ➢Define categories. ➢Define hierarchies. Chapter 3: Create Data Models ➢Understand the concepts of data modelling, primary & foreign keys, relationships, star schema, snowflake schema, and relationships cardinality. www.credosystemz.com
➢Create relationships. Chapter 4: DAX Calculated columns and measurements. ➢Implicit and explicit measures. ➢Understand filter context in visualization. ➢List of DAX Operators. ➢DAX function categories. ➢Maths and Stats functions. ➢Logical functions ➢Text functions ➢Filter functions ➢Date & Time functions. ➢Use RELATED with the related table. ➢Different count functions. ➢CALCULATE function. Chapter 5: Reports Development: ➢Understand the report view. ➢Formatting options. ➢Filtering options. Chapter 6: Publishing the report to power service cloud. Chapter 7: Licensing Options. Chapter 8: On-Premises Data Gateway Chapter 9: Administration, Security, and Compliance Chapter 10: Intermediate: ➢Introduction to star schema. www.credosystemz.com
➢Develop the case study “Tamil Nadu Election Analysis” : Convert flat file to starschema. ➢Load and transform the flat file. ➢Create dimension tables ➢Create fact file. ➢Group the queries to organize better. ➢Create models. ➢Generate Reports. Chapter 11: Custom Visuals: ➢Text Filter ➢Tornado ➢Word Count. Chapter 12: Machine Learning ➢Forecasting ➢Clustering Chapter 13: Power BI Data Storage Options Chapter 14: Collaboration and Sharing Chapter 15: Advanced Step by Procedure of the following advanced visuals and their importance ➢Pareto Chart ➢Key Influencer ➢Decomposition Tree. ➢Water Fall ➢What if www.credosystemz.com
Chapter 16: Report Development Best Practices. Chapter 17: Practice Test for Exam and Discussion. www.credosystemz.com