Power-BI-Course
Microsoft Power BI, the powerful analytics tool that has emerged as the leader in business analytics. Power BI Certification Training Course in Chennai! Master the art of creating data models and designing DAX Formulas with the guidance of experienced professional trainers

Power-BI-Course
E N D
Presentation Transcript
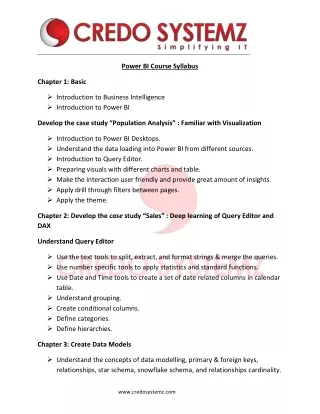
Power BI Course Syllabus Chapter 1: Basic ➢Introduction to Business Intelligence ➢Introduction to Power BI Develop the case study “Population Analysis” : Familiar with Visualization ➢Introduction to Power BI Desktops. ➢Understand the data loading into Power BI from different sources. ➢Introduction to Query Editor. ➢Preparing visuals with different charts and table. ➢Make the interaction user friendly and provide great amount of insights. ➢Apply drill through filters between pages. ➢Apply the theme. Chapter 2: Develop the casestudy “Sales” : Deep learning of Query Editor and DAX Understand Query Editor ➢Use the text tools to split, extract, and format strings & merge the queries. ➢Use number specific tools to apply statistics and standard functions. ➢Use Date and Time tools to create a set of date related columns in calendar table. ➢Understand grouping. ➢Create conditional columns. ➢Define categories. ➢Define hierarchies. Chapter 3: Create Data Models ➢Understand the concepts of data modelling, primary & foreign keys, relationships, star schema, snowflake schema, and relationships cardinality. www.credosystemz.com
➢Create relationships. Chapter 4: DAX Calculated columns and measurements. ➢Implicit and explicit measures. ➢Understand filter context in visualization. ➢List of DAX Operators. ➢DAX function categories. ➢Maths and Stats functions. ➢Logical functions ➢Text functions ➢Filter functions ➢Date & Time functions. ➢Use RELATED with the related table. ➢Different count functions. ➢CALCULATE function. Chapter 5: Reports Development: ➢Understand the report view. ➢Formatting options. ➢Filtering options. Chapter 6: Publishing the report to power service cloud. Chapter 7: Licensing Options. Chapter 8: On-Premises Data Gateway Chapter 9: Administration, Security, and Compliance Chapter 10: Intermediate: ➢Introduction to star schema. www.credosystemz.com
➢Develop the case study “Tamil Nadu Election Analysis” : Convert flat file to starschema. ➢Load and transform the flat file. ➢Create dimension tables ➢Create fact file. ➢Group the queries to organize better. ➢Create models. ➢Generate Reports. Chapter 11: Custom Visuals: ➢Text Filter ➢Tornado ➢Word Count. Chapter 12: Machine Learning ➢Forecasting ➢Clustering Chapter 13: Power BI Data Storage Options Chapter 14: Collaboration and Sharing Chapter 15: Advanced Step by Procedure of the following advanced visuals and their importance ➢Pareto Chart ➢Key Influencer ➢Decomposition Tree. ➢Water Fall ➢What if www.credosystemz.com
Chapter 16: Report Development Best Practices. Chapter 17: Practice Test for Exam and Discussion. www.credosystemz.com