Download
1 / 56
560 likes | 672 Views
The T3 Tax as a Policy Strategy for Global Warming. Ross R. McKitrick, Ph.D. Associate Professor of Economics University of Guelph. My background. Ph.D. (Econ), UBC 1996 >2 dozen peer-reviewed journal articles in both economics and climatology journals

E N D
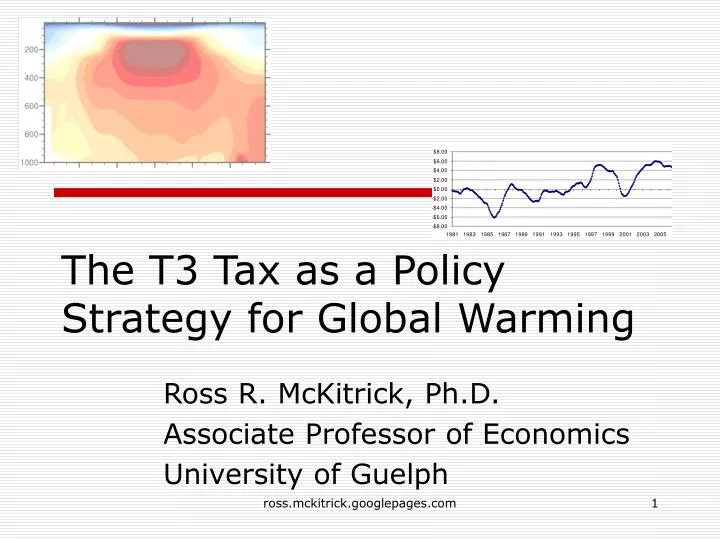
The T3 Tax as a Policy Strategy for Global Warming Ross R. McKitrick, Ph.D. Associate Professor of Economics University of Guelph ross.mckitrick.googlepages.com
My background • Ph.D. (Econ), UBC 1996 • >2 dozen peer-reviewed journal articles in both economics and climatology journals • Book: Taken By Storm, 2002 Donner Prize • Web site: • ross.mckitrick.googlepages.com • This talk: click on ‘T3 Tax’ ross.mckitrick.googlepages.com
Outline • Basic logic of the T3 Tax • 2 Components • Role of the tropical troposphere • Pricing CO2 emissions with a tax • How it would work • Adapting to C&T system ross.mckitrick.googlepages.com
Basic Logic • Suppose we put a low initial price on CO2 emissions. • Then pick a stable temperature measure that tracks the effect of CO2 on the global climate. • Now tie the level of the tax to the temperature measure ross.mckitrick.googlepages.com
Basic Logic • If the temperature trends up, so does the tax • But if the temperature doesn’t change, neither does the tax • The tax might even go down over time. • Whatever happens, it is the right outcome. • We don’t have to know in advance who’s right. • Everyone expects to get their preferred outcome. ross.mckitrick.googlepages.com
The temperature measure • Two recent reports: • IPCC 2007 • US CCSP 2006 • Both identify the key region for measuring GHG-induced warming: The troposphere over the tropics ross.mckitrick.googlepages.com
Tropical troposphere • 8-16 km above the surface • 30N to 30S • Half the atmosphere ross.mckitrick.googlepages.com
Tropical troposphere • 8-16 km above the surface • 30N to 30S • Half the atmosphere ross.mckitrick.googlepages.com
Tropical troposphere • 8-16 km above the surface • 30N to 30S • Half the atmosphere ross.mckitrick.googlepages.com
IPCC Hindcast 1890-1999 AR4 Fig9.1 ross.mckitrick.googlepages.com
IPCC Hindcast 1890-1999 Sun Volcanoes AR4 Fig9.1 GHG’s O3 Depletion SO4 Aerosols Total ross.mckitrick.googlepages.com
US Climate Change Science Program Report (2006) Page 25 1958-1999 Hindcast Same outcome TT Trend should be underway ross.mckitrick.googlepages.com
Future projections in IPCC AR4 (Figure 10.7) ross.mckitrick.googlepages.com
Future projections in IPCC AR4 (Figure 10.7) ross.mckitrick.googlepages.com
Future projections in IPCC AR4 (Figure 10.7) ross.mckitrick.googlepages.com
Future projections in IPCC AR4 (Figure 10.7) ross.mckitrick.googlepages.com
Future projections in IPCC AR4 (Figure 10.7) ross.mckitrick.googlepages.com
Future projections in IPCC AR4 (Figure 10.7) ross.mckitrick.googlepages.com
Future projections in IPCC AR4 (Figure 10.7) ross.mckitrick.googlepages.com
Future projections in IPCC AR4 (Figure 10.7) ross.mckitrick.googlepages.com
Future projections in IPCC AR4 (Figure 10.7) ross.mckitrick.googlepages.com
Future projections in IPCC AR4 (Figure 10.7) ross.mckitrick.googlepages.com
Future projections in IPCC AR4 (Figure 10.7) ross.mckitrick.googlepages.com
Future projections in IPCC AR4 (Figure 10.7) ross.mckitrick.googlepages.com
Future projections in IPCC AR4 (Figure 10.7) ross.mckitrick.googlepages.com
Features expected in data • Warming of tropical troposphere: • Should be underway if CO2 is driving climate • Will lead future warming • Only GHG’s will do it – unique signature ross.mckitrick.googlepages.com
Good data exist • Good-quality daily measurements by NOAA satellites, analysed by independent teams at RSS and UAH ross.mckitrick.googlepages.com
Compilation of current trends (IPCC AR4, Fig 3.4.3) • At present: positive but insignificant trend in tropical troposphere ross.mckitrick.googlepages.com
Surface data: measurement problems • Half the world’s met network disappeared in early 1990s • Other problems: urban heat bias, discontinuities, etc. • Poles subject to confounding influences ross.mckitrick.googlepages.com
Tropical Troposphere Temperature (T3) • Science tells us this is the feature of climate to monitor • High-quality data, continuous monitoring ensures good data are available ross.mckitrick.googlepages.com
PART II: Carbon taxes • Regulators can use price or quantity target ross.mckitrick.googlepages.com
“Demand curve” • Shows marginal value of additional emissions -or- • Marginal Abatement Cost (MAC) of reducing emissions ross.mckitrick.googlepages.com
Price or quantity? • We’ll be wrong either way • How to minimize expected economic cost of making wrong guess: • Make choice along axis with least uncertainty ross.mckitrick.googlepages.com
Price or quantity? • CO2 case • Optimal quantity is extremely uncertain • Optimal price range is likely small ross.mckitrick.googlepages.com
Marginal Damages • Tol (2005) • If models are correct, optimal price is around $5 US / tonne Relatively little price uncertainty ross.mckitrick.googlepages.com
Debating price removes incentive to understate or exaggerate control costs • Optimists vs. pessimists ross.mckitrick.googlepages.com
Revenue recycling • Good options: • Reduce income taxes • Swedish NOx model: refund to industry according to output share • I oppose the Tech Fund approach • Undermines economic incentives • Political involvement in investment decisions • Steers money to inefficient projects ross.mckitrick.googlepages.com
T3 Formula • Use satellite (MSU) data to get T3 • Mean of UAH & RSS estimates • 3-year moving average x 20 ross.mckitrick.googlepages.com
T3 Rate since 1981 • Current value = $4.76 ross.mckitrick.googlepages.com
IPCC Projections • 0.2 – 1.2 C/decade warming in Tropical Troposphere • Implies $4 - $24 rise in T3 tax per decade • Actual rate depends on actual warming ross.mckitrick.googlepages.com
In principle, everyone should like it • Skeptics will like it (or they should): they expect the tax will stay flat or fall • Alarmists will like it (or they should): they expect the tax to soar • Policymakers will like it because they don’t have to guess who’s right, and it yields the right outcome either way ross.mckitrick.googlepages.com
Benefit for policy maker • Alarmists say things like • “Your climate policy is too weak! We have to cut carbon emissions faster, because the science shows global warming is a crisis!” ross.mckitrick.googlepages.com
Benefit for policy maker • Simple Answer • “Maybe you’re right. And if you are, the carbon price will rise rapidly, forcing the rapid cuts you are calling for.” ross.mckitrick.googlepages.com
Another criticism • It starts too low! At $5 nobody will cut emissions. • Answer: It starts low because the social costs of carbon emissions are low. If carbon emissions cause bigger effects in the future, the tax will rise. But if nobody cuts emissions for $5/tonne, so be it. They are paying the social cost of their emissions, that’s the important thing. ross.mckitrick.googlepages.com
Forward-looking aspect • One criticism is that we have to see the warming happen before the price changes • 2 responses • First, the tropical troposphere is the atmosphere’s “leading indicator”—warming there leads surface effects • Second, investors have to be forward-looking • Today’s decisions are based on forecast of tax rates 5-10 years from now • This way, investors will start building in projections of future warming into today’s decisions ross.mckitrick.googlepages.com
Added benefit: market for ACCURATE climate forecasts • Investors will need accurate forecasts of tropical troposphere climate • Today’s GCM’s are tuned to meet academic needs, not forecasting needs • Market for accuracy may lead to scientific improvements in climate modeling ross.mckitrick.googlepages.com
Applying T3 rule to tradable permits • Set cap, auction or give away permits • Set ‘safety valve’ price using T3 formula • Essentially becomes a tax with tradable exemptions ross.mckitrick.googlepages.com
Summary • There must be a feedback between the actual effects and the stringency of policy • The tropical troposphere is where the effect of GHG’s should be assessed • Tie the price of carbon emissions to the mean tropospheric temperature and we get the right outcome over time without knowing in advance who’s right. ross.mckitrick.googlepages.com
End ross.mckitrick.googlepages.com
Tropics: Aloft versus Surface • Warming at surface > warming aloft ross.mckitrick.googlepages.com