Download
1 / 1
10 likes | 180 Views
A . B . C. D. Samples. Grow Cells with Glycerol at 30 0 C Replicate 3. Grow Cells with Glycerol at 30 0 C Replicate 1. Grow Cells with Glucose at 30 0 C (3 replicates). Grow Cells with Glycerol at 30 0 C Replicate 2. Protein extraction followed by trypsin digestion.

E N D
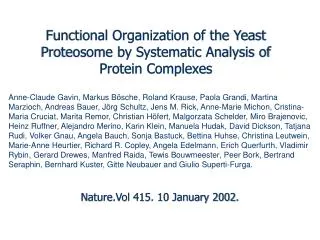
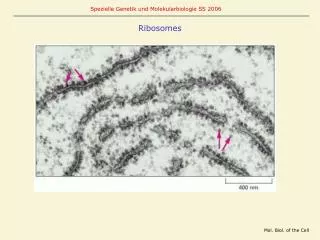
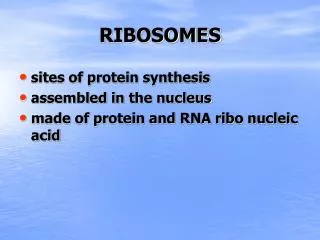
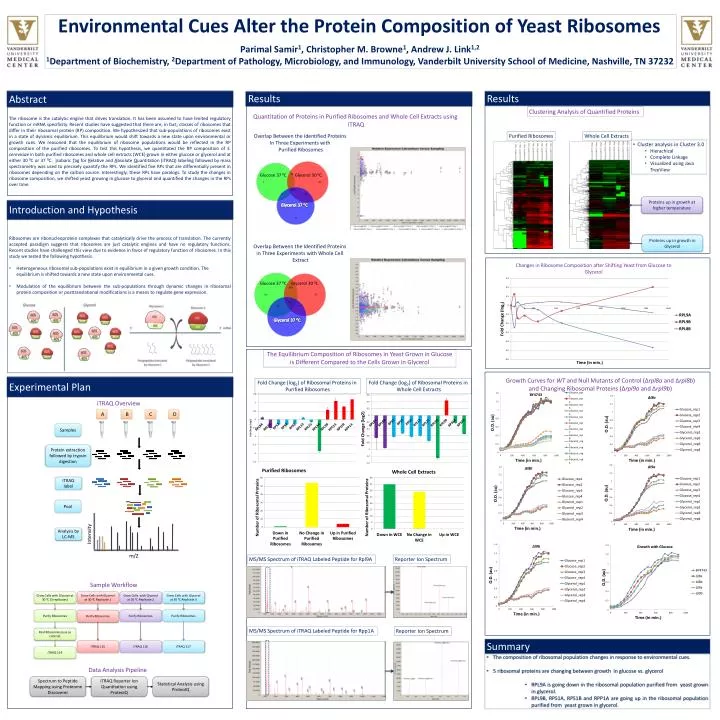
A B C D Samples Grow Cells with Glycerol at 30 0C Replicate 3 Grow Cells with Glycerol at 30 0C Replicate 1 Grow Cells with Glucose at 30 0C (3 replicates) Grow Cells with Glycerol at 30 0C Replicate 2 Protein extraction followed by trypsin digestion Environmental Cues Alter the Protein Composition of Yeast Ribosomes Parimal Samir1, Christopher M. Browne1, Andrew J. Link1,21Department of Biochemistry, 2Department of Pathology, Microbiology, and Immunology, Vanderbilt University School of Medicine, Nashville, TN 37232 Purify Ribosomes Purify Ribosomes Purify Ribosomes Purify Ribosomes Spectrum to Peptide Mapping using Proteome Discoverer iTRAQ Reporter Ion Quantitation using ProteoIQ Statistical Analysis using ProteoIQ iTRAQ label Pool Ribosomes (use as control) iTRAQ 115 iTRAQ 117 iTRAQ 116 iTRAQ 114 Pool Abstract Introduction and Hypothesis Results Experimental Plan Analysis by LC-MS Intensity • Ribosomes are ribonucleoprotein complexes that catalytically drive the process of translation. The currently accepted paradigm suggests that ribosomes are just catalytic engines and have no regulatory functions. Recent studies have challenged this view due to evidence in favor of regulatory function of ribosomes. In this study we tested the following hypothesis. • Heterogeneous ribosomal sub-populations exist in equilibrium in a given growth condition. The equilibrium is shifted towards a new state upon environmental cues. • Modulation of the equilibrium between the sub-populations through dynamic changes in ribosomal protein composition or posttranslational modifications is a means to regulate gene expression. Fold Change (log2) of Ribosomal Proteins in Purified Ribosomes Fold Change (log2) of Ribosomal Proteins in Whole Cell Extracts Results The ribosome is the catalytic engine that drives translation. It has been assumed to have limited regulatory function or mRNA specificity. Recent studies have suggested that there are, in fact, classes of ribosomes that differ in their ribosomal protein (RP) composition. We hypothesized that sub-populations of ribosomes exist in a state of dynamic equilibrium. This equilibrium would shift towards a new state upon environmental or growth cues. We reasoned that the equilibrium of ribosome populations would be reflected in the RP composition of the purified ribosomes. To test this hypothesis, we quantitated the RP composition of S. cerevisiae in both purified ribosomes and whole cell extracts (WCE) grown in either glucose or glycerol and at either 30 0C or 37 0C. Isobaric Tag for Relative and Absolute Quantitation (iTRAQ) labeling followed by mass spectrometry was used to precisely quantify the RPs. We identified five RPs that are differentially present in ribosomes depending on the carbon source. Interestingly, these RPs have paralogs. To study the changes in ribosome composition, we shifted yeast growing in glucose to glycerol and quantified the changes in the RPs over time. Whole Cell Extracts Quantitation of Proteins in Purified Ribosomes and Whole Cell Extracts using iTRAQ m/Z Clustering Analysis of Quantified Proteins Glucose 37 0C Glycerol 30 0C Overlap Between the Identified Proteins In Three Experiments with Purified Ribosomes Purified Ribosomes • Cluster analysis in Cluster 3.0 • Hierachical • Complete Linkage • Visualized using Java TreeView Glycerol 37 0C Proteins up in growth at higher temperature Overlap Between the Identified Proteins in Three Experiments with Whole Cell Extract Proteins up in growth in Glycerol Glucose 37 0C Glycerol 30 0C Glycerol 37 0C The Equilibrium Composition of Ribosomes in Yeast Grown in Glucose is Different Compared to the Cells Grown in Glycerol iTRAQ Overview Growth Curves for WT and Null Mutants of Control (Δrpl8a andΔrpl8b) and Changing Ribosomal Proteins (Δrpl9a andΔrpl9b) MS/MS Spectrum of iTRAQ Labeled Peptide for Rpl9A Reporter Ion Spectrum MS/MS Spectrum of iTRAQ Labeled Peptide for Rpp1A Reporter Ion Spectrum Sample Workflow Summary • The composition of ribosomal population changes in response to environmental cues. • 5 ribosomal proteins are changing between growth in glucose vs. glycerol • RPL9A is going down in the ribosomal population purified from yeast grown in glycerol. • RPL9B, RPS1A, RPS1B and RPP1A are going up in the ribosomal population purified from yeast grown in glycerol. Data Analysis Pipeline