Download
1 / 27
270 likes | 436 Views
Analysis of the young uninsured adults. Tariro Mupombwa SUMR Mentor: Dr. Mark Pauly August 7, 2008. One would expect the uninsured to be…. Unemployed but most are employed Young but most are not young Poor but most are not poor Thus the uninsured are varied.

E N D
Analysis of the young uninsured adults Tariro Mupombwa SUMR Mentor: Dr. Mark Pauly August 7, 2008
One would expect the uninsured to be…. • Unemployed but most are employed • Young but most are not young • Poor but most are not poor Thus the uninsured are varied
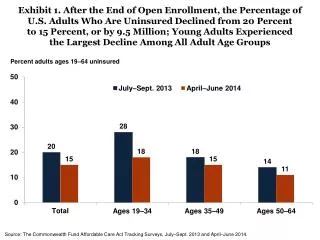
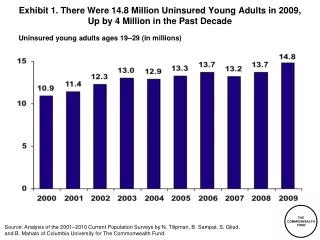
Why young adults become uninsured • Young adults (19-29) are one of the largest segments without health insurance • 2006: 13.6 million lacked coverage • Lose coverage at two critical transition points • 19th birthdays or upon high school graduation • College graduation • Dropped from parents’ policies or public insurance
Objectives • To see if household and individual incomes affect the chances of one being uninsured • To see if state policies lowered the number of young uninsured
Project progression Phase I: Reproducing 2008 Commonwealth fund report
Figure 1. There Are 13.7 Million Uninsured Young Adults,Ages 19–29, Almost 30 Percent of Nonelderly Uninsured, 2006 Age 18and under 20% Ages 50–64 15% Ages 36–49 23% Ages 19–23 13% Ages 24–29 16% Ages 30–35 12% Nonelderly uninsured = 46.4 million Note: Numbers may not sum to 100% because of rounding. Source: Analysis of the March 2007 Current Population Surveyby S. Glied and B. Mahato for The Commonwealth Fund.
Uninsured Young Adults, Ages 19–29,by Poverty Status and Race/Ethnicity Other 7% 200% FPL or more 29% Less than 100% FPL 41% White 45% Hispanic 33% 100%– 199% FPL 31% African American 15% Uninsured young adults = 13.7 million Note: Numbers may not sum to 100% because of rounding. Source: Analysis of the March 2007 Current Population Surveyby S. Glied and B. Mahato for The Commonwealth Fund. 34 percent of African Americans and 52 percent of Hispanics ages 19 to 29 are uninsured, compared with 23percent of whites in that age range
Phase II: Looking at household vs individual incomes
Calculating federal poverty level (FPL) • Individual income ratio calculation: incratio=income/9800 • Household income ratio calculation: incratio=hhincome/(9800+(3400*(hhsize-1)))
Commonwealth fund used individual incomes in looking at the uninsured young adults by poverty status
Combining household and individual incomes • Defined income: • below the poverty line as “Poor” (P) • above P but less than 200% of poverty as “low” (L) • above 200% as middle (M) • Thus we have nine possible combinations: • PP - poor household, poor individual • PL - poor household, low individual • PM - poor household, middle individual • LP - low household, poor individual • LL - low household, low individual • LM - low household, middle individual • MP - middle household, poor individual • ML - middle household, low individual • MM - middle household, middle individual
Key: PP - poor household, poor individualPL - poor household, low individualPM - poor household, middle individualLP - low household, poor individualLL - low household, low individualLM - low household, middle individualMP - middle household, poor individualML - middle household, low individualMM - middle household, middle individual
Conclusions • By far, the young adults most at risk of lacking coverage are those from low-income households. • About 72% of uninsured young adults have individual incomes of less than 200% compared to 43% if using household incomes • Thus, a young person’s chances of having coverage depends on both individual and household incomes • What does this imply about ideal subsidies to help people “afford” insurance?
Phase III: Effectiveness of policies that extend coverage to young adults
19 states have passed legislation that increases the age of dependency for young adults • Ranges from age 24 in Delaware, Indiana and South Dakota to age 30 in New Jersey • Apply to plans covered under state insurance regulations and not self-insured employers
Divided states into 3 groups • Group 1 – no rules extending coverage • Group 2 – passed rules before 2007 • Group 3 – passed rules after 2007
Calculated proportion of people uninsured in each age and income group • Categories: • PU - poor household, uninsured individual • PI - poor household, insured • LU - low household, uninsured individual • LI - low household, insured individual • MU - middle household, uninsured individual • MI - middle household, insured individual • Used household income • Combined groups 2&3
Middle household income Proportion of uninsured was 23% higher in states with laws
Low household income Proportion of uninsured was 1.22 and 1.20 for 19-22 and 23-26 respectively
Conclusions • Increasing age dependency increases family coverage premiums which might cause young adults (24-26) to drop coverage • Slight indication of a protective effect of law in low incomes • No evidence that suggests that state laws lower the number of young uninsured
Policy Implications • Extend eligibility for Medicaid/SCHIP public coverage beyond age 18 • Extend eligibility for dependents under private coverage beyond age 18 or 19, as 19 states have done • Ensure that all colleges and universities require full-time and part-time students to have health insurance, and that they offer health insurance coverage to both
Future Direction • Look at the spillovers of the young uninsured, if any at all
Special thanks to the following organizations for their generous support: • The University of Pennsylvania Provost’s Diversity Fund • The Center for Health Equity Research and Promotion (CHERP) • Pennsylvania Department of HealthOffice of Health Equity
Acknowledgements • Mark Pauly, PhD • Fredric Blavin, PhD candidate • Joanne Levy, MBA, MCP • SUMR scholars • Leonard Davis Institute