Download

1 / 8
80 likes | 202 Views
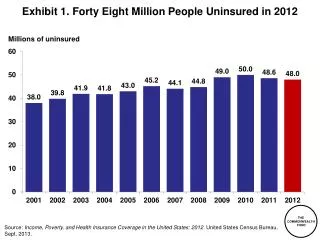
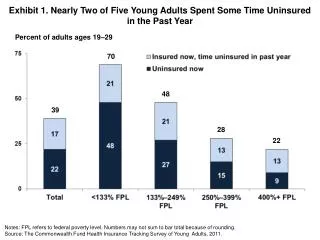
Exhibit 1. Nearly Two of Five Young Adults Spent Some Time Uninsured in the Past Year . Percent of adults ages 19–29. 70. 48. 39. 28. 22. Notes: FPL refers to federal poverty level. Numbers may not sum to bar total because of rounding.

E N D
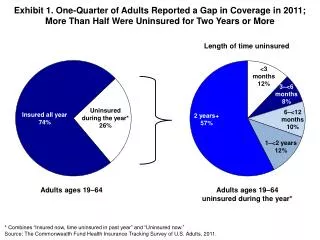
Exhibit 1. Nearly Two of Five Young Adults Spent Some Time Uninsured in the Past Year Percent of adults ages 19–29 70 48 39 28 22 Notes: FPL refers to federal poverty level. Numbers may not sum to bar total because of rounding. Source: The Commonwealth Fund Health Insurance Tracking Survey of Young Adults, 2011.
Exhibit 2. Nearly Three-Quarters of Uninsured Young Adults Had Incomes Under 250 Percent of Poverty 400%+ FPL 14% 250%–399% FPL 15% <133% FPL 45% 133%–249% FPL 27% Distribution of 10.4 million uninsured* adults ages 19–29 * Uninsured indicates uninsured at the time of the survey. Notes: FPL refers to federal poverty level. Numbers may not sum to 100 because of rounding. Source: The Commonwealth Fund Health Insurance Tracking Survey of Young Adults, 2011.
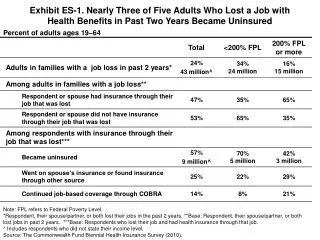
Exhibit 3. Half of Young Adults Who Lost a Job with Health Benefits from November 2009 to November 2011 Became Uninsured When you lost your job, what happened to your health insurance? Went on parent’s insurance 14% Became uninsured 52% Did not have insurance through job 68% Had insurance through job 31% COBRA 16% Went on spouse/ partner’s insurance 5% Refused 1% Found insurance through other source 13% Adults ages 19–29 who lost a job in the past two years Adults ages 19–29 who had insurance through job Source: The Commonwealth Fund Health Insurance Tracking Survey of Young Adults, 2011.
Exhibit 4. Two of Five Young Adults Experienced a Cost-Related Problem Getting Needed Care Percent of adults ages 19–29 who experienced the following access problems in the past year because of cost: * Experienced any of the following because of cost: did not fill a prescription; skipped a recommended test, treatment, or follow-up; had a medical problem, did not visit a doctor or clinic; did not get needed specialist care. Source: The Commonwealth Fund Health Insurance Tracking Survey of Young Adults, 2011.
Exhibit 5. More Than One-Third of Young Adults Experienced a Medical Bill Problem or Were Paying Off Medical Debt Percent of adults ages 19–29 who experienced the following medical bill problems or accrued medical debt in the past year: * Experienced any of the following in the past year: had problems paying medical bills; contacted by a collection agency for unpaid bills; had to change way of life to pay bills; is paying off medical bills/debt over time. Source: The Commonwealth Fund Health Insurance Tracking Survey of Young Adults, 2011.
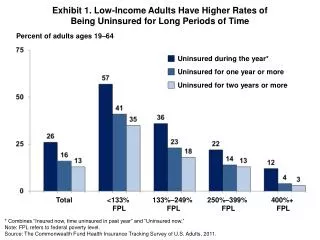
Exhibit 6. Young Adults with Low and Moderate Incomes, Both Insured and Uninsured, Reported Medical Bill and Debt Problems at Highest Rates Percent of adults ages 19–29 who experienced a medical bill problem or accrued medical debt in the past year* Note: FPL refers to federal poverty level. * Experienced any of the following in the past year: had problems paying medical bills; contacted by a collection agency for unpaid bills; had to change way of life to pay bills; is paying off medical bills/debt over time. ** Combines “Insured now, time uninsured in past year” and “Uninsured now”. Source: The Commonwealth Fund Health Insurance Tracking Survey of Young Adults, 2011.
Exhibit 7. Two of Five Young Adults with Medical Bill Problems or Debt Used Up All Their Savings Because of Their Bills or Debt Percent of adults ages 19–29 with medical bill problems or accrued medical debt* Note: FPL refers to federal poverty level. * Base: Had problems paying or unable to pay medical bills; were contacted by a collection agency for unpaid medical bills; had to change way of life to pay bills; had medical bills or debt being paid off over time. Source: The Commonwealth Fund Health Insurance Tracking Survey of Young Adults, 2011.
Exhibit 8. Premium Tax Credits and Cost-Sharing ProtectionsUnder the Affordable Care Act Catastrophic policy with essential benefits package available to young adults and people who cannot find plan premium <8% of income Notes: FPL refers to federal poverty level; levels are for 2011. Actuarial values are the average percent of medical costs covered by a health plan. Premium and cost-sharing credits are for the Silver plan. Source: Commonwealth Fund Health Reform Resource Center: What’s in the Affordable Care Act? (PL 111-148 and 111-152), http://www.commonwealthfund.org/Health-Reform/Health-Reform-Resource.aspx.