Download
1 / 18
180 likes | 301 Views
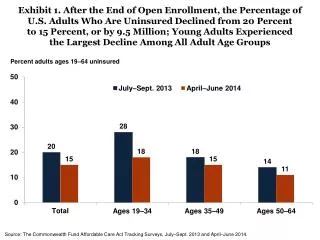
Exhibit 1. After the End of Open Enrollment, the Percentage of U.S. Adults Who Are Uninsured Declined from 20 Percent to 15 Percent, or b y 9.5 Million; Young Adults Experienced the Largest Decline Among All Adult Age Groups. Percent adults ages 19–64 uninsured.

E N D
Exhibit 1. After the End of Open Enrollment, the Percentage of U.S. Adults Who Are Uninsured Declined from 20 Percent to 15 Percent, or by 9.5 Million; Young Adults Experienced the Largest Decline Among All Adult Age Groups Percent adults ages 19–64 uninsured Source: The Commonwealth Fund Affordable Care Act Tracking Surveys, July–Sept. 2013 and April–June 2014.
Exhibit 2. Across Incomes and Racial and Ethnic Groups, Adults with Low Incomes and Latinos Experienced the Largest Declines in Uninsured Rates Percent adults ages 19–64 uninsured Income Race/Ethnicity Note: FPL refers to federal poverty level. Source: The Commonwealth Fund Affordable Care Act Tracking Surveys, July–Sept. 2013 and April–June 2014.
Exhibit 3. The Percent of Uninsured Adults with Incomes Under 100 Percent of Poverty Fell Sharply in States That Expanded Medicaid; More Than a Third of Poor Adults Remained Uninsured in States That Did Not Expand Medicaid Percent adults ages 19–64 with incomes below 100 percent of poverty who were uninsured (25 states + D.C.) (25 states) • Note: States were coded as expanding their Medicaid program if they began enrolling individuals in April or earlier. These states include AR, AZ, CA, CO, CT, DE, HI, IA, IL, KY, MA, MD, MI, MN, ND, NJ, NM, NV, NY, OH, OR, RI, VT, WA, WV, and the District of Columbia. All other states were coded as not expanding. • Source: The Commonwealth Fund Affordable Care Act Tracking Surveys, July–Sept. 2013 and April–June 2014.
Exhibit 4. Uninsured Rates Fell Sharply in California and Texas; Florida and Texas Continue to Have the Highest Uninsured Rates Among Largest States Percent adults ages 19–64 uninsured Source: The Commonwealth Fund Affordable Care Act Tracking Surveys, July–Sept. 2013 and April–June 2014.
Exhibit 5. Awareness of the Affordable Care Act’s Marketplaces and Financial Assistance Among Potentially Eligible Adults Doubled by the End of Open Enrollment Since the beginning of October, under the health reform law, also known as the Affordable Care Act, new marketplaces have been open in each state where people who do not have affordable health insurance through a job can shop and sign up for health insurance. Are you aware of this new marketplace in your state? Many people without affordable health benefits through a job may be eligible for financial help to pay for their health insurance in these new marketplaces. Are you aware that financial assistance for health insurance is available under the reform law? Percent aware Adults ages 19–64 who are uninsured or have individual coverage * Question wording changed between the July–September survey and the April–June survey. Source: The Commonwealth Fund Affordable Care Act Tracking Surveys, July–Sept. 2013 and April–June 2014.
Exhibit 6. More Than Two of Five Adults Who Were Potentially Eligible for Coverage Had Visited a Marketplace by June, Up from 24 Percent in December Have you gone to this new marketplace to shop for health insurance? This could be by mail, in person, by phone, or on the Internet. Percent who visited marketplace Adults ages 19–64 who are uninsured or have individual coverage Source: The Commonwealth Fund Affordable Care Act Tracking Surveys, Oct. 2013, Dec. 2013 and April–June 2014.
Exhibit 7. Of Adults Who Visited the Marketplaces, Three of 10 Selected a Private Plan and One of Five Enrolled in Medicaid, by June 2014 Did you select a private health plan or enroll in Medicaid through the marketplace? Did not select aprivate plan orenroll in Medicaid Selected a privatehealth plan Enrolled inMedicaid Selected a plan,but not sure ifprivate or Medicaid 51 48 48 56 Adults ages 19–64 who went to marketplace Note: Bars may not sum to indicated total because of rounding. This question was asked only of those individuals who said they had visited a marketplace. More people may have enrolled in coverage through Medicaid or a qualified health plan outside of the marketplace. Source: The Commonwealth Fund Affordable Care Act Tracking Survey, April–June 2014.
Exhibit 8. Young Adults Composed a Greater Share of New Adult Medicaid Enrollment, Older Adults a Greater Share of Marketplace Enrollment Total new enrollees* ages 19–64 • Selected a private plan through marketplace • Enrolled in Medicaid** 35–49 32% 35–49 30% 35–49 33% 19–34 42% 50–64 43% 19–34 33% 50–64 34% 19–34 24% 50–64 25% Refused 1% Refused 2% Refused 3% Notes: Segments may not sum to 100 percent because of rounding. * New enrollees include those who signed up for private coverage through the marketplace, those who signed up for Medicaid through the marketplace, those who signed up for coverage through the marketplace but are not sure if it is Medicaid or private coverage, and those who have been enrolled in Medicaid for less than 1 year. ** This includes some individuals who enrolled in Medicaid outside of the marketplace, but have been covered by Medicaid for less than 1 year. Source: The Commonwealth Fund Affordable Care Act Tracking Survey, April–June 2014.
Exhibit 9. More Than Three of Five Adults Who Selected a Private Plan or Enrolled in Medicaid Were Uninsured Prior to Gaining Coverage What type of health insurance did you have prior to getting your new coverage? Percent Adults ages 19–64 who selected a private plan or enrolled in Medicaid through marketplace or have had Medicaid for less than 1 year * New enrollees include those who signed up for private coverage through the marketplace, those who signed up for Medicaid through the marketplace, those who signed up for coverage through the marketplace but are not sure if it is Medicaid or private coverage, and those who have been enrolled in Medicaid for less than 1 year. ** This includes some individuals who enrolled in Medicaid outside of the marketplace, but have been covered by Medicaid for less than 1 year. Source: The Commonwealth Fund Affordable Care Act Tracking Survey, April–June 2014.
Exhibit 10. Four of Five Adults with New Coverage Said They Were Very or Somewhat Optimistic That Their New Coverage Would Improve Their Ability to Get the Care They Need Overall, how optimistic are you that your new health insurance is going to improve your ability to get the health care that you need? Not at all optimistic Not very optimistic Somewhat optimistic Very optimistic 17 81 17 81 16 81 11 86 23 75 12 85 18 81 19 78 13 85 31 66 88 11 22 78 12 85 Adults ages 19–64 who selected a private plan or enrolled in Medicaid through marketplace or have had Medicaid for less than 1 year Notes: Segments may not sum to indicated total because of rounding. Bars may not sum to 100 percent because of don’t know/refusal to respond. FPL refers to federal poverty level. * This includes some individuals who enrolled in Medicaid outside of the marketplace, but have been covered by Medicaid for less than 1 year. Source: The Commonwealth Fund Affordable Care Act Tracking Survey, April–June 2014.
Exhibit 11. A Majority of Adults with New Coverage Said They Were Better Off Now Would you say you are better off now or worse off now than you were before you had this new plan, or has there been no effect? Percent Adults ages 19–64 who selected a private plan or enrolled in Medicaid through marketplace or have had Medicaid for less than 1 year * This includes some individuals who enrolled in Medicaid outside of the marketplace, but have been covered by Medicaid for less than 1 year. ** Respondent said health status was fair or poor or said they had at least one of the following chronic diseases: hypertension or high blood pressure; heart disease; diabetes; asthma, emphysema, or lung disease; high cholesterol; depression or anxiety. Source: The Commonwealth Fund Affordable Care Act Tracking Survey, April–June 2014.
Exhibit 12. More Than Three-Quarters of Adults with New Coverage Said They Were Very or Somewhat Satisfied with It Overall, how satisfied are you with this new health insurance? Not at all satisfied Not very satisfied Somewhat satisfied Very satisfied 14 78 13 79 16 77 11 84 19 73 10 87 15 78 15 73 10 82 27 65 9 85 17 74 13 82 Adults ages 19–64 who selected a private plan or enrolled in Medicaid through marketplace or have had Medicaid for less than 1 year Notes: Segments may not sum to indicated total because of rounding. Bars may not sum to 100 percent because of don’t know/refusal to respond. FPL refers to federal poverty level. * This includes some individuals who enrolled in Medicaid outside of the marketplace, but have been covered by Medicaid for less than 1 year. Source: The Commonwealth Fund Affordable Care Act Tracking Survey, April–June 2014.
Exhibit 13. Three of Five Adults with New Coverage Said They Had Used Their Plan; of Those, Three of Five Said They Would Not Have Been Able to Access or Afford This Care Before Have you used your new health insurance plan to visit a doctor, hospital, or other health care provider, or to pay for prescription drugs? Prior to getting your new health insurance plan, would you have been able to access and/or afford this care? No 34% Yes 60% No 62% Yes 36% Don’t know or refused 2% Plan has not yet gone into effect 6% Adults ages 19–64 who have used new health insurance plan Adults ages 19–64 who selected a private plan or enrolled in Medicaid through the marketplace or have had Medicaid for less than 1 year Note: Segments may not sum to 100 percent because of rounding. Source: The Commonwealth Fund Affordable Care Act Tracking Survey, April–June 2014.
Exhibit 14. Among Adults Who Enrolled in New Coverage, More Than Half Said Their Plan Included All or Some of the Doctors They Wanted; Two of Five Did Not Know Which Doctors Were on Their Plan Does the plan you selected or your new Medicaid coverage include all, some, or none of the doctors that you wanted? Percent Adults ages 19–64 who selected a private plan or enrolled in Medicaid through the marketplace or have had Medicaid for less than 1 year Source: The Commonwealth Fund Affordable Care Act Tracking Survey, April–June 2014.
Exhibit 15. One of Five Adults with New Coverage Tried to Find a Primary Care Doctor; Three-Quarters Found It Easy or Somewhat Easy to Find One Since getting your new health plan or Medicaid coverage, have you tried to find a new primary care doctor or general doctor? How easy or difficult was it for you to find a new primary care doctor or general doctor? Very easy 39% Somewhat easy 36% No 78% Yes 21% Somewhat difficult 10% Don’t know or refused 1% Could not find a doctor 7% Very difficult 7% Adults ages 19–64 who selected a private plan or enrolled in Medicaid through marketplace or have had Medicaid for less than 1 year Adults ages 19–64 who have tried to find new primary care or general doctor Note: Segments may not sum to 100 percent because of rounding. Source: The Commonwealth Fund Affordable Care Act Tracking Survey, April–June 2014.
Exhibit 16. Two-Thirds of Those Who Found a Primary Care Doctor Got an Appointment Within Two Weeks How long did you have to wait to get your first appointment to see this doctor? Percent Adults ages 19–64 who selected a private plan or enrolled in Medicaid through marketplace or have had Medicaid for less than 1 year and tried to find a primary care doctor or general doctor since getting new coverage* * Does not include those who were not able to find a doctor. Source: The Commonwealth Fund Affordable Care Act Tracking Survey, April–June 2014.
Exhibit 17. Thirty Percent of Adults with New Coverage Saw or Needed a Specialist; Fifty-Eight Percent Got an Appointment Within Two Weeks Since getting your new health plan or Medicaid coverage, have you seen or needed to see any specialist doctors? How long did you have to wait to get your first appointment to see this specialist? 8 to 14 days 22% Within 1 week 36% No 70% Yes 30% 15 to 30 days 17% More than 30 days 16% Don’t know or refused 2% Don’t know or refused 1% Have not tried to make appointment 5% Still waiting 2% Adults ages 19–64 who selected a private plan or enrolled in Medicaid through marketplace or have had Medicaid for less than 1 year Adults ages 19–64 who needed to see specialist Note: Segments may not sum to 100 percent because of rounding. Source: The Commonwealth Fund Affordable Care Act Tracking Survey, April–June 2014.
Exhibit 18. More Than Two of Five Adults Who Selected a Private Plan Had the Option to Choose a Narrow Network Plan; Half Chose One Some health plans provide more limited choices for doctors, clinics, and hospitals and charge lower premiums than plans with a larger selection of doctors and hospitals. When you were deciding which plan to choose, did you have the option of choosing a less expensive plan with fewer doctors or fewer hospitals? Did you select the less expensive plan with fewer doctors or hospitals? No 33% Yes 42% Yes 51% No 44% Don’t know 25% Don’t know 5% Adults ages 19–64 who selected a private plan through the marketplace Adults ages 19–64 who had the option to choose less expensive plan with fewer providers Note: Segments may not sum to 100 percent because of rounding. Source: The Commonwealth Fund Affordable Care Act Tracking Survey, April–June 2014.