Advanced Query Optimization Techniques for Database Management
Learn about query optimization, query language, compilation and execution planning, algebraic space, and optimizations for efficient database management.

Advanced Query Optimization Techniques for Database Management
E N D
Presentation Transcript
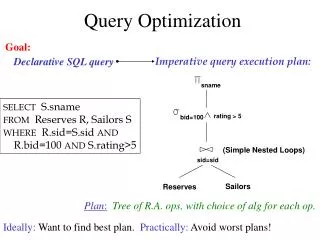
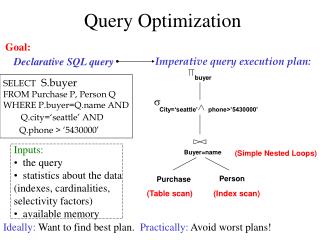
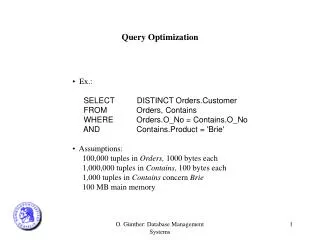
Example emp(name, age, sal, dno) dept(dno, dname, floor, budget, mgr, ano) acnt(ano, type, balance, bno) bank(bno, bname, address) select name, floor from emp, dept where emp.dno = dept.dno and sal > 100K
Example Number of emp pages 20000 Number of emp tuples 100000 Number of emp tuples > 100K 10 Number of dept pages 10 Number of dept tuples 100 Indices of emp clustered B+tree on emp.sal (3 levels deep) Indices of dept clustered hashing on dept.dno (average bucket length of 1.2 pages) Number of buffer pages 3 Cost of one disk access 20ms
Example Plan 1 Use the B+ tree to find all tuples of emp that satisfy the selection For each one, use the hashing index to fond the corresponding dept tuples (nested loops, using the index on both relations. (3 + 1 + 10 * 1.2) blocks* 20ms/block 0.32 sec
Example Plan 2 For each dept page, scan the entire emp relation, If an emp tuple agrees on the dno attribute with the tuple on the dept page that satisfies the selection on emp.sal then the emp.dept tuple pairs appears in the result (page-level nested loops, using no index (10 + 10 * 20000) blocks* 20ms/block ~ 1h
Example Plan 3 For each dept tuple, scan the entire emp relation and store all emp-dept pairs Then, scan this set, for each one check if it has the same values in the two dno attributes and satisfy the selection on emp.sal (tuple-level formation of the cross product, with subsequent scan to test the join and the (3 * 100 * 20000) blocks* 20ms/block ~ 1 day +
Overview Embedded queries Query language (SQL) Query Parser Relational Calculus compile time Query Optimizer Relational and Physical Algebra Code Generator/Interpreter Record-at-a-time calls Query Processor run time
Overview of Query Optimizer Applies transformation (static) Rewriting Stage (declarative) Rewriter Specifies the arithmetic formulas used to estimate the cost of execution plans Planning Stage (procedural) Cost Model Planner Algebraic Space Examines all possible plans for each query produced in the previous stage (through a search strategy to examine the space of execution plans) Execution orders to be consider by the planner Size-Distribution Estimator Method-structure space Implementation choices for the execution of each ordered series of actions
Overview of Query Optimizer Rewriter Cost Model Planner Algebraic Space Size-Distribution Estimator Method-structure space
Algebraic Space Rewriter Cost Model Planner Algebraic Space Size-Distribution Estimator select-project-join (SPJ) represented as a tree Enormous number of trees Method-structure space
Algebraic Space select name, floor from emp, dept where emp.dno = dept.dno and sal > 100K Trees of Plan 1, Plan 2, Plan 3 (pg 10)
Algebraic Space Restriction 1 Selections and projections are processed on the fly and almost never generate intermediate relations. Selections are processed as relations are accessed for the first time. Projections are processed as the results of other operators are generated. NOTE:: P1 satisfies R1 R1 eliminates only suboptimal query trees, thus the algebraic space module specifies only alternative query tees with join operations only (selection and projection being implicit)
Algebraic Space R1 join R2 R2 join R1 which relations inner and which outer (R1 join R2) join R3 R1 join (R2 join R3) order in which joins are executed Large number => need to further restrict Restriction 2 Cross products are never formed, unless the query itself asks for them. Relations are combined always through joins in the query.
Algebraic Space select name, floor, balance from emp, dept, accnt where emp.dno = dept.dno and dept.ano = acnt.ano 3 Trees (pg 11) R2 almost always eliminates suboptimal query trees, thus the algebraic space module specifies only alternative query tees that do not involve cross products
Algebraic Space Restriction 3 The inner operand of each join is a database relation, never an intermediate result select name, floor, balance, address from emp, dept, accnt, bank where emp.dno = dept.dno and dept.ano = acnt.ano and act.bno = bank.bno 3 Trees (pg 13) T1 satisfies R3
Algebraic Space left-deep (inner being a database relation) right-deep (outer being a database relation, bushy (at least one join between two intermediate results) • Why left-deep • Having original database relations as inners increases the use of any pre-existing indices • Having intermediate relations as outers allows sequences of nested loops joins to be executed in a pipelined fashion (although right-deep favors sequence of hash joins)
Algebraic Space R3 significantly reduces the number if alternative join trees, thus the algebraic space module of the typical query optimizer only specifies join trees that are left-deep. In summary, typical query optimizers make restrictions R1, R2 and R3 to reduce the size of the space they explore
Planner Rewriter Algebraic Space Cost Model Planner Method-structure space Explores the set of alternative execution plans as specified by the algebraic space and the method-structure space and find the cheapest one as determined by the cost model and the size distribution estimator Size-Distribution Estimator
Planner Dynamic Programming A dynamically pruning exhaustive search algorithm: Constructs all alternative join trees (that satisfy R1-R3) by iterating on the number of relations joined so far, always pruning trees that are known to be suboptimal Merge scan - if one is sorted on its join attribute the sorting step may be skipped => take into account the sorted order (if any) in which the result comes out Interesting orders :: orders of intermediate results on any relation attributes that participate in joins
Planner: dynamic programming Step 1 For each relation in the query, all possible way to access it (i.e., via all existing indices + sequential scan) are obtained Partition these partial result (single-relation) into equivalence classes based on any interesting order in which they produce their result) Estimate the cost (by the cost model module) and retain the cheapest plan in each equivalence class (except of the no-order class if it is not the cheaper one)
Planner: dynamic programming Step 2 For each pair of relations joined in the query, all possible ways to evaluate their join using the relation access paths retained after Step 1 are obtained. Partition and pruning of these partial (two-relation) plans as above
Planner: dynamic programming Step i For each set of i -1 relations joined in the query, the cheapest plans to join them for each interesting order are known from the previous step. For each such set (of i- 1 relations joined), all possible ways to join one more relation with it without creating a cross product are evaluated For each set of i relations joined, all generated (partial) plans are partitioned and pruned as before.
Planner: dynamic programming Step N All possible plans to answer the query (the unique set of N relations in the query) are generated from the plans retained in the previous step. The cheapest plan is the final output of the optimizer, to be used to process the query.
Planner: dynamic programming Finds the optimal plan among those satisfying restrictions R1-R3. In general, exponential with the number of joins (N) since in the worst case all viable partial plans must be stored in each step. In practice, usually O(N3) Many systems limit the number of joins (~15) See detailed example in the paper
Planner: randomized algorithm Randomized Algorithms (algorithms that flip coins to make decisions) Operate by searching a graph whose nodes are all the alternative execution plans that can be used to answer a query. Each node has a cost associated with it, and the goal of the algorithm is to find a node with the globally minimum cost Randomized algorithms perform random walks in the graph via a series of moves.
Planner: randomized algorithm Randomized algorithms perform random walks in the graph via a series of moves. The nodes that can be reached in one move from a node S are called the neighbors of S. Uphill move (resp. downhill) if the cost of the source node is lower (resp. higher) than the cost of the destination node A node is a global minimum if it has the lowest cost among all nodes A node is a local minimum if, in all paths starting at the node, any downhill move comes after at one uphill move.
Planner: randomized algorithm Simulated Annealing performs a continous random walk accepting downhill moves always ad uphill moves with some probability trying to avoid being caught in a high cost local minimum. Returns the node with the lowest cost visited Iterative Improvement performs a large number of local optimizations. Each one starts at a random node and repeatedly accepts random downhill moves until it reaches a local minimum. Returns th local minimum with the lowest cost found
Planner For up to 10 joins dynamic programming works better
Size-Distribution Estimator Rewriter Cost Model Planner Algebraic Space Size-Distribution Estimator Method-structure space Given a query, it estimated the sizes of the results of (sub) queries and the frequency distributions of values in attributes of these results
Size-Distribution Estimator: Example Name Salary Department Zeus 100K General Manager Poseidon 80K Defense Pluto 80K Justice Aris 50K Defense Ermis 60K Commerce Apollo 60K Energy Hefestus 50K Energy Hera 90K General Manager Athena 70K Education Aphrodite 60K Domestic Affairs Demeter 60K Agriculture Hestia 50K Domestic Affairs Artemis 60K Energy Department Frequency General Manager 2 Defense 2 Education 1 Domestic Affairs 2 Agriculture 1 Commerce 1 Justice 1 Energy 3 Similarly discuss distribution of frequencies of combinations of arbitrary number of attributes Attribute value independence assumption
Size-Distribution Estimator: Histograms In a histogram on attribute a of relation R, the domain of a is partitioned into buckets, and a uniform distribution is assumed within each bucket. That is, for any bucket b in the histogram, if the value ui b, then the frequency fi of ui is approximated by uj b fj/ |b| Trivial Any subset of the attribute’s domain may form a bucket
Size-Distribution Estimator: Histograms Department Frequency in Bucket Approximate Frequency General Manager 2 1.75 Defense 2 1.5 Education 1 1.75 Domestic Affairs 2 1.5 Agriculture 1 1.5 Commerce 1 1.5 Justice 1 1.75 Energy 3 1.75 2 buckets
Size-Distribution Estimator: Histograms Department Frequency in Bucket Approximate Frequency General Manager21.33 Defense 2 1.33 Education 11.33 Domestic Affairs 22.5 Agriculture 1 1.33 Commerce 1 1.33 Justice 11.33 Energy 3 2.5 2 buckets
Size-Distribution Estimator: Histograms Department Frequency in Bucket Approximate Frequency General Manager 2 1.75 Defense 2 1.5 Education 1 1.75 Domestic Affairs 2 1.5 Agriculture 1 1.5 Commerce 1 1.5 Justice 1 1.75 Energy 3 1.75 Equi-width: the number of consecutive attribute values or the size of the range of attributes values associated with each bucket is the same First bucket 4 values A – D Second bucket 4 values E-Z
Size-Distribution Estimator: Histograms Department Frequency in Bucket Approximate Frequency General Manager21.33 Defense 2 1.33 Education 11.33 Domestic Affairs 22.5 Agriculture 1 1.33 Commerce 1 1.33 Justice 11.33 Energy 3 2.5 Serial the frequencies of the attribute values associated with each bucket are either all greater or are all less than the frequencies of the attribute values associated with any other bucket
Parallel Databases • Intra-operator parallelism • Inter-operator parallelism (pipelining and independent parallelism)
Distributed Databases • communication cost • various forms of joins
Advanced Query Optimization Semantic query optimization: use integrity constraints to rewrite a given query Global query optimization: multiple queries become available for optimization at the same time (queries with unions, multiple concurrent users, etc) Derive a query plan optimal for the execution of all of them as a group