Non-parametric test
Non-parametric test. Introduction, Wilcoxon rank sum test and Man-Whitney U test Reporter: Shao-Li Han. Non-Parametric Test. Parametric tests: certain assumptions Non-parametric tests: fewer assumptions need . Advantage. Few or no assumption Reduce the effect of the outlies


Non-parametric test
E N D
Presentation Transcript
Non-parametric test Introduction, Wilcoxon rank sum test and Man-Whitney U test Reporter: Shao-Li Han
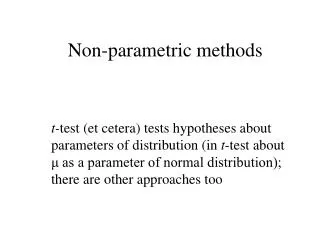
Non-Parametric Test • Parametric tests: certain assumptions • Non-parametric tests: fewer assumptions need
Advantage • Few or no assumption • Reduce the effect of the outlies • Even for ordinal and sometimes even nominal data Nominal data: Ex. Marriage status: single, marriage, devoiced, widow… Ordinal data: Ex. The academic performance: A, B, C, D and E
Statistic Character • No estimate of variance • No confidence interval • Fewer measures of effect size • Chi-Square test of independence is one of non-parametric statitics • Median, instead of the mean Not as powerful as parametric alternatives!!
Sign Test • When to apply: conditions that single sample t-test are not met. • Binomial test • Example 1
Observation • Use less number • One tail or 2 tails =>excel function, =binomdistprovided one tail probablity • Not for ranked-signs, for example 1, there should be different influence in “50” and “25” on the result, although the signs of the two value are all “1”. Wilcoxon’s ranked-sign test!
Wilcoxon Rank Sum Test for Independent Samples • 2 independent samples are drawn from populations with an ordinal distribution. • H0: the observations come from the same population. • The probability when x0> y0 and x0<y0 is just the same • They have the same medians. W left tail statistc • Example 2 Nominal data: Ex. Marriage status: single, marriage, devoiced, widow… Ordinal data: Ex. The academic performance: A, B, C, D and E
Different sample size • A bit more care is required • W represents the left tail static; W’ for right tail statictic • Using reverse ranking • Example
If 2 samples are sufficiently large • Sample size > 10 or greater than 20 • Wilcoxon table • W statistic is approximately normal N(μ,σ) • Example 3
Effect Size • Given by the correlation coefficient • (M1-M2)/Standard deviation
Mann-Whitney U Test • Alternative form of Wilcoxon rank-Sum test • No matter which sample is bigger!! • Mann-Whitney Tables • Observed value of U < Ucrit -> Reject the hypothesis • Mathematic processing …ex. U1+U2=n1*n2… • Examples…
Example • ADHD vs non-ADHD children • Academic performance, A, B, C among students from a given grade 1 elementary school. • By using Wilcoxon rank sum test or Mann-Whitney U test • Sample size > 20 (in excel file)