Non-parametric tests
Non-parametric tests. They make minimal population assumptions They are distribution-free tests. They do not compare means. Non-parametric tests. …include the following methods. The sign test The Mann-Whitney U test Chi-squared Wilcoxon matched-pairs signed-ranks test


Non-parametric tests
E N D
Presentation Transcript
Non-parametric tests They make minimal population assumptions They are distribution-free tests. They do not compare means.
Non-parametric tests... • …include the following methods. • The sign test • The Mann-Whitney U test • Chi-squared • Wilcoxon matched-pairs signed-ranks test • Kruskal-Wallis test • In general, non-parametric tests are less powerful than parametric tests.
Chi-squared (c2) • c2 requires frequencies in groups. • Two uses of c2 (analogous to one-way and factorial ANOVA): • Test of goodness of fit (One grouping variable) • Test of independence (Two grouping variables) • c2 compares an observed frequency distribution with a theoretical model expected frequency distribution.
Models for c2 • The theoretical model may be chance, which leads us to expect the same number of observations in each category or group. • Thus, if we have 40 observations and four categories or groups, we expect 10 observations in each group. • If we have 107 observations and three categories, we expect 107/3 = 35.667 observations in each category.
A non-chance model • We may have a basis for a non-chance theoretical model, if prior research or theory tells us the proportions or percentages of observations to expect in each group.
Examples of theoretical models • For example, a genetic model might predict proportions of 9:3:3:1 for four kinds of pea hybrids. A sociological model of a neighborhood might predict 40% single-parent homes, 55% dual-parent homes, and 5% three-parent homes.
I. The goodness of fit c2 • Form your data into columns, one for observed frequencies fo and one for expected frequencies fe. • Ensure that the sum of fo = the sum of fe. • Form a third column, fo - fe. • Form a fourth column, (fo - fe)2 • Form a fifth column, (fo - fe)2 / fe • c2 is the sum of column 5.
An example • c2 = S[(fo - fe)2 / fe ] • Here is a chi-squared comparing the distribution of men and women in a class with a theoretical 50:50 model: fo fefo - fe (fo - fe)2 [fo - fe)2 / fe Men 12 15 -3 9 0.6 Women 18 15 3 9 0.6 c2 = 1.2 df = k-1=1. c2crit = 3.84, so retain H0 .
Interpreting c2 • In the goodness of fit test, H0 states that the observed frequencies are essentially the same (within chance variation) as the expected frequencies. • If we reject H0, we believe that the observed frequency distribution is different from the model of expected frequencies.
II. c2 test of independence • The contingency table • Two grouping variables: Are they related or independent? Republican Democrat SRows Men 10 5 15 Women 20 30 50 SColumns 30 35 65
Worked example: Republican Democrat SRows Men 10 5 15 Women 20 30 50 SColumns 30 35 65 Obtain fe from the marginal sums. The fe for a particular cell equals its row marginal times its column marginal divided by the grand total: (30 x 15)/65 for Republican men, for example.
Example... Republican Democrat SRows Men 10 5 15 Women 20 30 50 SColumns 30 35 65 Republican men: (30 x 15)/65 = 450/65 = 6.923 Republican women: (30 x 50)/65 = 1500/65 = 23.077 Democrat men: (35 x 15)/65 = 525/65 = 8.077 Democrat women: (35 x 50)/65 = 1750/65 = 26.923
And the c2 is... Group fo fe (fo - fe) (fo - fe)2 (fo -fe)2/fe Rep.Men 10 6.923 3.077 9.468 1.368 R.Women 20 23.077 3.077 9.468 0.410 Dem.Men 5 8.077 -3.077 9.468 1.172 D.Women 30 26.923 -3.077 9.468 0.352 c2 = 3.302 df = (r-1)(c-1)=1. c2crit = 3.84, so retain H0 .
Interpreting c2... • In the test of independence, H0 states that the frequencies for each group on one grouping variable are unrelated to (independent of) the groups of the other variable: Political party is unrelated to gender. • If we reject H0, we believe that the frequencies for each group on one grouping variable depend on (are different for) the groups of the other variable: Men and women differ in their political party.
c2 details • Observations must be independent. That is, no person or thing counted in one cell can be counted in any other cell. • If there are 3 or more rows or columns, the expected frequency of each cell must be at least 5. If there are fewer than 3 rows and columns, the expected frequency of each cell must be at least 10. Otherwise, use Fisher’s exact test.
More c2 details • Virtually any data set can be reduced to frequencies of nominal scores to permit c2 testing. • However, remember that non-parametric tests have less power than parametrics.
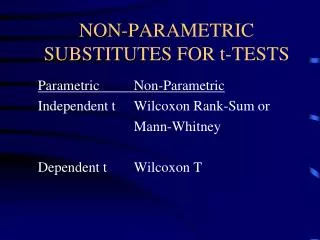
The Wilcoxon Matched-Pairs Signed Ranks Test • A non-parametric test for paired data, Wilcoxon is used in place of the t-test for paired samples (correlated groups t) when the t-test assumptions are seriously violated. • It is less powerful than t, but more powerful than the sign test. • The data must be ordinal, interval, or ratio, but not nominal.
Computing Wilcoxon • From the paired scores, compute a column of D(ifference) scores, as with the sign test and t for correlated groups. • Rank the absolute values (sizes) of the differences. • Re-apply the algebraic signs of the differences to the rank values. • Find the sum of the positive ranks, and the sum of the negative ranks. • The smaller sum is the Wilcoxon statistic T. • Compare the obtained value of T to table I.
The Mann-Whitney U test • Used in place of t for independent samples when assumptions are severely violated. • Like Wilcoxon, requires ordinal, interval, or ratio data, but not nominal. • U is obtained by ranking the combined scores of both groups. Then, find the sum of the ranks for each group separately. • Apply the U formula.
Kruskal-Wallis • Used in place of ANOVA for independent samples when the assumptions of ANOVA are seriously violated. • Useful for ordinal, interval, or ratio data.