Download
1 / 11
110 likes | 251 Views
X-ray Spectroscopy of Laboratory and Astrophysical Plasmas. David Cohen Department of Physics and Astronomy Swarthmore College http://astro.swarthmore.edu/~cohen. Broad Questions I’m Trying To Answer How do hot stars produce X-rays?

E N D
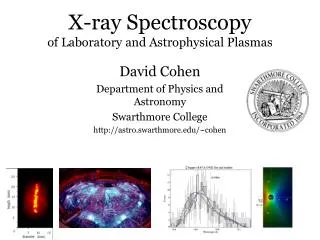
X-ray Spectroscopyof Laboratory and Astrophysical Plasmas David Cohen Department of Physics and Astronomy Swarthmore College http://astro.swarthmore.edu/~cohen
Broad Questions I’m Trying To Answer • How do hot stars produce X-rays? • How does material near compact objects respond to accretion-driven X-ray emission? With the launch of Chandra and XMM in 1999 high resolution spectroscopy is possible for the first time. Quantitative diagnostics of plasma conditions
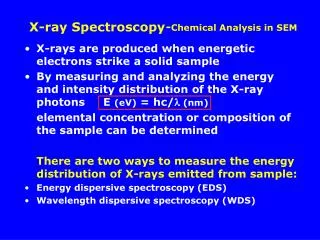
Topic #1: Hot Star X-rays - Chandra HETGS spectrum of the O star z Pup • Pup (O4 I) Si XIV Ne XII Fe XVII Ne XI O VIII N V O VII 10 Å 20 Å
Focusing in on a characteristic portion of the spectrum 15 Å 12 Å • Pup (O4 I) A cooler star: coronal/dynamo source Ne X Fe XVII Ne IX
Differences in the line shapes become apparent when we look at a single line (here Ne X, Lya) • The O star’s lines are Doppler broadened • Unlike in cool stars, x-ray emission in hot stars has something to do with these stars’ stellar winds The shapes of these broadened lines tells us about the kinematics and spatial distribution of the x-ray emitting plasma • Pup (O4 I) Capella (G2 III)
My students are fitting these x-ray line profiles with wind-shock models fit to data The kinematics of the hot, wind-shocked plasma and the absorption by the cooler portion of the stellar wind reproduces the blueshifted, skewed line profiles.
Topic #2: X-ray binaries and AGN have x-ray spectra that are characterized by photoionization (rather than by collisional processes, as is the case with stellar coronae and supernovae). X-ray spectral modeling of photoionized plasmas needs to be benchmarked by laboratory experiments.
The Z-Machine at Sandia - world’s most powerful x-ray source (2 MJ in 10 ns 200 TW of X-ray power) Capacitor bank discharges during a ‘shot’. Current implodes a cylindrical wire array, producing x-rays. We field a small container of gas (O, Ne, Ar, Fe…) near the pinch, exposing it to x-rays, and create an x-ray photoionized nebula, which we monitor spectroscopically.
Students of mine run simulations of the Z-pinch implosion and the irradiance of the gas cell. We also do hydro and spectral modeling of the gas. gas cell
We have obtained absorption spectra (to monitor the ionization balance in the gas); Soon we will also obtain emission spectra, which will be compared to Chandra spectra of XRBs and AGNs. Ne IX between 10 Å and 11.5 Å A section of our raw data (above). Note the very high principle quantum number lines of He-like neon.
There’s a lot happening in astrophysical x-ray spectroscopy these days Numerical modeling is required to get the most out of this new, high quality data. Connections between astrophysics and laboratory physics are useful.